Housing Starts:
Privately-owned housing starts in January were at a seasonally adjusted annual rate of 890,000. This is 8.5 percent below the revised December estimate of 973,000, but is 23.6 percent above the January 2012 rate of 720,000.
Single-family housing starts in January were at a rate of 613,000; this is 0.8 percent above the revised December figure of 608,000. The January rate for units in buildings with five units or more was 260,000.
Building Permits:
Privately-owned housing units authorized by building permits in January were at a seasonally adjusted annual rate of 925,000. This is 1.8 percent above the revised December rate of 909,000 and is 35.2 percent above the January 2012 estimate of 684,000.
Single-family authorizations in January were at a rate of 584,000; this is 1.9 percent above the revised December figure of 573,000. Authorizations of units in buildings with five units or more were at a rate of 311,000 in January.
 Click on graph for larger image.
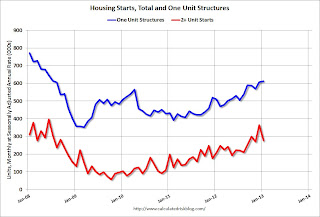
The first graph shows single and multi-family housing starts for the last several years.
Multi-family starts (red, 2+ units) decreased sharply in January.
Single-family starts (blue) increased to 613,000 thousand in January and are at the highest level since 2008.
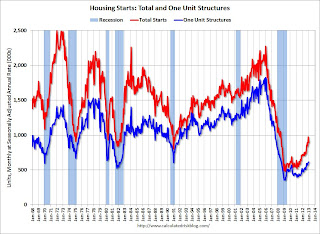
The second graph shows total and single unit starts since 1968.
 This shows the huge collapse following the housing bubble, and that housing starts have been increasing lately after moving sideways for about two years and a half years.
 Total starts are up about 86% from the bottom start rate, and single family starts are up about 74 percent from the post-bubble low.
This was below expectations of 914 thousand starts in January due to the sharp decrease in the volatile multi-family sector. Starts in January were up 23.6% from January 2012. I'll have more later, but this was a solid report.