by Calculated Risk on 2/05/2013 08:23:00 PM
Tuesday, February 05, 2013
Update: Seasonal Pattern for House Prices
There is a clear seasonal pattern for house prices. Even in normal times house prices tend to be stronger in the spring and early summer, than in the fall and winter. Recently there has been a stronger than normal seasonal pattern because conventional sales are following the normal pattern (more sales in the spring and summer), but distressed sales (foreclosures and short sales) happen all year. So distressed sales have had a larger negative impact on prices in the fall and winter.
However, house prices - not seasonally adjusted (NSA) - have been pretty strong over the last few months - at the start of the normally weak months.
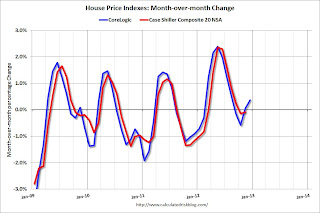
 Click on graph for larger image.
This graph shows the month-to-month change in the CoreLogic and NSA Case-Shiller Composite 20 index over the last several years (Case-Shiller through November, CoreLogic through December).
The CoreLogic index has been positive in both the November and December reports (CoreLogic is a 3 month weighted average, with the most recent month weighted the most).
Case-Shiller NSA turned negative month-to-month in the October report (also a three month average, but not weighted), but was only slightly negative in November. I expect more inventory to come on the market over the next few months than during the spring of 2011 and 2012, and that might slow the price increases - but it looks like the "off-season" for prices will be pretty strong.


