by Calculated Risk on 3/16/2013 08:30:00 AM
Saturday, March 16, 2013
Summary for Week ending March 15th
This was another week of solid economic data. Retail sales were strong even after removing the impact of higher gasoline prices. Industrial production is at a new post-recession high and nearing the pre-recession peak. And the four-week average of initial weekly unemployment claims is at the lowest level since March 2008.
One negative was a fairly sharp decline in consumer sentiment, but that survey indicated that the decline was mostly dissatisfaction with policymakers and that buying plans were essentially unchanged.
The recent good news - even without any housing data (the key driver) - has led to some upgraded forecasts for Q1 GDP. I've excerpted a from a few research notes below. All of these analysts are upgrading their Q1 forecasts, but are still cautious about Q2 and Q3 due to fiscal policy and inventory adjustments.
From Goldman Sachs:
The US consumer has proven more resilient to the increase in payroll and income taxes than we had expected, and we are lifting our near-term GDP growth forecast slightly. Our tracking estimate for Q1 has already climbed to 2.9% and we are raising Q2 from 1.5% to 2%, primarily via stronger consumption.From Merill Lynch:
Our upgrade is modest for three reasons. First, the growth pickup in Q1 is partly due to faster inventory accumulation. Second, while consumption is holding up better than expected, it is unlikely to be strong in absolute terms. Third, we still expect the “sequester” to weigh on growth in the near term.
One of the key elements of our below-consensus forecast is that consumer spending will slow amid higher taxes and fiscal cuts. The data continue to challenge this view. February retail sales jumped 1.1% and “core control” sales, which net out the volatile components of autos, building materials and gasoline, increased 0.4%. Coupled with stronger inventory growth, this led us to revise up our forecast for 1Q GDP growth to 3.0%. We are also taking up 2Q GDP to 1.3% from 1.0% to reflect stronger momentum. This leaves full year growth at 1.8%, versus our prior forecast of 1.5%. That said, we are not entirely capitulating on our forecast – we still believe growth will slow in coming months as the sequester kicks in, but from a higher level.From Nomura:
Incoming data point to faster-than-expected growth in the first quarter. The need to replenish inventories and an apparent delay by households to adjustment to higher tax burdens at the start of the year has lifted current quarter growth tracking to an annual rate of 2.5%. However, it now appears that the 1 March spending cuts (sequester) will be in place until at least the end of September. These new cuts in spending will slow growth in Q2 and Q3 (previously we assumed that only half of these cuts would be implemented).Here is a summary of last week in graphs:
• Retail Sales increased 1.1% in February
 Click on graph for larger image.
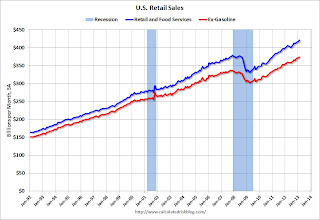
On a monthly basis, retail sales increased 1.1% from January to February (seasonally adjusted), and sales were up 4.6% from February 2012. Sales for December were revised up to a 0.2% gain.
This graph shows retail sales since 1992. This is monthly retail sales and food service, seasonally adjusted (total and ex-gasoline).
Retail sales are up 27.2% from the bottom, and now 11.2% above the pre-recession peak (not inflation adjusted)
Retail sales ex-autos increased 1.0%. Retail sales ex-gasoline increased 0.6%.
This was above the consensus forecast of a 0.5% increase. Although higher gasoline prices boosted sales, retail sales ex-gasoline increased 0.6% - suggesting some pickup in the economy in February.
• Fed: Industrial Production increased 0.7% in February
 "The capacity utilization rate for total industry increased to 79.6 percent."
This graph shows Capacity Utilization. This series is up 12.8 percentage points from the record low set in June 2009 (the series starts in 1967).
Capacity utilization at 79.6% is still 0.6 percentage points below its average from 1972 to 2010 and below the pre-recession level of 80.6% in December 2007.
Note: y-axis doesn't start at zero to better show the change.
 The second graph shows industrial production since 1967.
"Industrial production increased 0.7 percent in February after having been unchanged in January". Industrial production increased in February to 99.5. This is 19.2% above the recession low, but still 1.2% below the pre-recession peak.
The monthly change for both Industrial Production and Capacity Utilization were above expectations.
• Weekly Initial Unemployment Claims decrease to 332,000
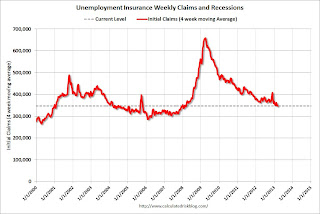
 This graph shows the 4-week moving average of weekly claims since January 2000.
The dashed line on the graph is the current 4-week average. The four-week average of weekly unemployment claims decreased to 346,750 - this is the lowest level since early March 2008.
Weekly claims were below the 350,000 consensus forecast.
Claims might increase over the next few months due to the "sequestration" budget cuts, but right now initial unemployment claims suggest an improving labor market.
• Key Measures of inflation in February
 This graph shows the year-over-year change for four key measures of inflation: the median Consumer Price Index, 16% trimmed-mean Consumer Price Index, core CPI and core PCE.
On a year-over-year basis, the median CPI rose 2.2%, the trimmed-mean CPI rose 1.9%, and the CPI less food and energy rose 2.0%. Core PCE is for January and increased 1.3% year-over-year.
On a monthly basis, median CPI was at 2.9% annualized, trimmed-mean CPI was at 2.6% annualized, and core CPI increased 2.1% annualized. Also core PCE for January increased 1.8% annualized.
The Fed will meet next week, and with this level of inflation and the current high level of unemployment, I expect the Fed will keep the "pedal to the metal".
• BLS: Job Openings "little changed" in January
 From the BLS: Job Openings and Labor Turnover Summary
 This graph shows job openings (yellow line), hires (dark blue), Layoff, Discharges and other (red column), and Quits (light blue column) from the JOLTS.
This series started in December 2000.
Jobs openings increased in January to 3.693 million, up from 3.612 million in December. The number of job openings (yellow) has generally been trending up, and openings are up 8% year-over-year compared to January 2012.
Quits increased in January, and quits are up 13% year-over-year and at the highest level since 2008. These are voluntary separations. (see light blue columns at bottom of graph for trend for "quits").
Not much changes month-to-month in this report, but the trend suggests a gradually improving labor market.
• Preliminary March Consumer Sentiment declined to 71.8
 The preliminary Reuters / University of Michigan consumer sentiment index for March declined to 71.8 from the February reading of 77.6.
 This was well below the consensus forecast of 77.7, and very low. There are a number of factors that impact sentiment including unemployment, gasoline prices and, for 2013, the payroll tax increase and even politics (sequestration, default threats, etc).
In this case, the decline was probably related to both high gasoline prices and policy concerns. According to Reuters, a record 34 percent of those surveyed were negative about government economic policies (sequestration, etc.). Reuters also reports that buying plans were essentially unchanged.


