by Calculated Risk on 5/07/2013 06:07:00 PM
Tuesday, May 07, 2013
Temporary Help Services and Employment
Back in 2010, some analysts took the surge in temporary help services as a leading indicator for a pickup in employment. I was skeptical back then, first because of the distortion caused by temporary Census workers, second because housing was still weak, and third because it appeared there had been a change in hiring practices.
Once again there has been a pickup in temporary help services. From the BLS report:
In April, employment rose in temporary help services (+31,000) ...Temporary help services has added an average of 28,000 jobs per month over the last three months.
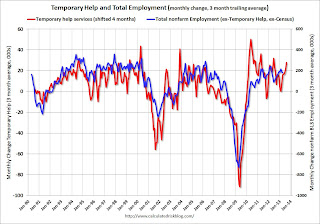
The following graph was a favorite of those expecting a huge rebound in employment in 2010 (see the red spike in 2010). The graph is a little complicated - the red line is the three month average change in temporary help services (left axis). This is shifted four months into the future.
The blue line (right axis) is the three month average change in total employment (excluding temporary help services and Census hiring).
 Click on graph for larger image.
 Unfortunately the data on temporary help services only goes back to 1990, but it does appear that temporary help leads employment by about four months (although noisy).
The thinking is that before companies hire permanent employees following a recession, employers will hire temporary employees. But there is also evidence of a recent shift by employers to more temporary workers.
This graph does suggest temporary help services does lead general employment, but the magnitude of the swings is less useful - and I don't think this suggests an imminent pickup in overall hiring.


