by Calculated Risk on 6/17/2013 05:56:00 PM
Monday, June 17, 2013
FNC: House prices increased 4.6% year-over-year in April
In addition to Case-Shiller, CoreLogic, FHFA and LPS, I'm also watching the FNC, Zillow and several other house price indexes.
From FNC: FNC Index: Rise in Home Prices Picks up in April
The latest FNC Residential Price Index™ (RPI) shows that U.S. home prices continue to rise in April, up 0.7% from the previous month. April’s gain marks the largest price acceleration since June 2012, caused in part by rising seasonal demand entering spring and summer.Note: This increase is partially seasonal. This year prices were up 0.7% in April (from March). Last year, in April 2012, prices were up 1.0% in April - so this is slower seasonal price appreciation.
... Based on recorded sales of non-distressed properties (existing and new homes) in the 100 largest metropolitan areas, the FNC 100-MSA composite index shows that April home prices rose much faster than in the previous months. The two narrower indices (30-MSA and 10-MSA composites) similarly recoded a nearly 1.0% increase. On a year-over-year basis, home prices were up 4.6% from a year ago. The indices have been revised downward for the prior months, resulting in more moderate annual price accelerations.
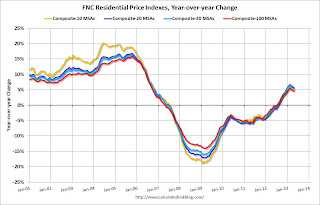
The year-over-year change slowed in April, with the 100-MSA composite up 4.6% compared to April 2012. The FNC index turned positive on a year-over-year basis in July, 2012.
 Click on graph for larger image.
This graph shows the year-over-year change for the FNC Composite 10, 20, 30 and 100 indexes. Note: The FNC indexes are hedonic price indexes using a blend of sold homes and real-time appraisals.
Even with the recent increase, the FNC composite 100 index is still off 28.6% from the peak.


