by Calculated Risk on 10/12/2013 09:55:00 AM
Saturday, October 12, 2013
Schedule for Week of October 13th
Special Note: With the government shutdown, some economic data has been delayed. The last section below is a list of delayed reports so far. If the shutdown ends, some of these delayed reports might be released this week.
The key event this week will be the probable agreement on paying the bills and opening the government.
There are two housing reports that were scheduled to be released this week, housing starts on Thursday, and homebuilder confidence survey on Wednesday.
For manufacturing, September Industrial Production (DELAYED), and the NY Fed (Empire State) and Philly Fed October surveys are scheduled to be released this week. For prices, CPI (DELAYED) was scheduled to be released on Wednesday.
All US markets are open on Columbus Day holiday.
9:00 PM ET: Speech by Fed Chairman Ben Bernanke, Celebrating 20 Years of Mexican Central Bank Independence, At the Conference Sponsored by the Bank of Mexico: Central Bank Independence – Progress and Challenges, Mexico City, Mexico
8:30 AM: NY Fed Empire Manufacturing Survey for October. The consensus is for a reading of 7.0, up from 6.3 in September (above zero is expansion).
7:00 AM: The Mortgage Bankers Association (MBA) will release the results for the mortgage purchase applications index.
8:30 AM: Consumer Price Index for September. The consensus is for a 0.2% increase in CPI in September and for core CPI to increase 0.2%.
10:00 AM ET: The October NAHB homebuilder survey. The consensus is for a reading of 57, down from 58 in September. Any number above 50 indicates that more builders view sales conditions as good than poor.
2:00 PM: Federal Reserve Beige Book, an informal review by the Federal Reserve Banks of current economic conditions in their Districts.
8:30 AM: The initial weekly unemployment claims report will be released. The consensus is for claims to decrease to 330 thousand from 374 thousand last week. This data is gathered by the states and will continue to be released.
 8:30 AM: Housing Starts for September.
 Total housing starts were at 891 thousand (SAAR) in August. Single family starts were at 628 thousand SAAR in August.
The consensus is for total housing starts to increase to 913 thousand (SAAR) in September.
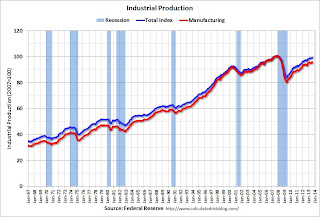
 9:15 AM: The Fed was scheduled to release Industrial Production and Capacity Utilization for September. From the Fed:
 The industrial production indexes that are published in the G.17 Statistical Release on Industrial Production and Capacity Utilization incorporate a range of data from other government agencies, the publication of which has been delayed as a result of the federal government shutdown. Consequently, the G.17 release will not be published as scheduled on October 17, 2013. After the reopening of the federal government, the Federal Reserve will announce a publication date for the G.17 release.This graph shows industrial production since 1967.
The consensus is for a 0.4% increase in Industrial Production, and for Capacity Utilization to increase to 78.1%.
10:00 AM: the Philly Fed manufacturing survey for October. The consensus is for a reading of 15.0, down from 22.3 last month (above zero indicates expansion).
10:00 AM: Conference Board Leading Indicators for September. The consensus is for a 0.6% increase in this index.
Delayed: Construction Spending for August. The consensus is for a 0.4% increase in construction spending.
Delayed: Manufacturers' Shipments, Inventories and Orders (Factory Orders) for August. The consensus is for a 0.2% increase in orders.
Delayed: Employment Report for September. The consensus is for an increase of 178,000 non-farm payroll jobs in September; the economy added 169,000 non-farm payroll jobs in August. The consensus is for the unemployment rate to be unchanged at 7.3% in September.
 Delayed: Trade Balance report for August from the Census Bureau.
 Imports increased in July, and exports decreased.
The consensus is for the U.S. trade deficit to increase to $40.0 billion in August from $39.1 billion in July.
 Delayed: Job Openings and Labor Turnover Survey for August from the BLS.
 This graph shows job openings (yellow line), hires (purple), Layoff, Discharges and other (red column), and Quits (light blue column) from the JOLTS.
Jobs openings decreased in July to 3.689 million, down from 3.869 million in June. number of job openings (yellow) is up 5.4% year-over-year compared to July 2012.
Quits were up in July, and quits are up about 8% year-over-year. These are voluntary separations. (see light blue columns at bottom of graph for trend for "quits").
Delayed: Monthly Wholesale Trade: Sales and Inventories for August. The consensus is for a 0.4% increase in inventories.
 Delayed: Retail sales for September.
This graph shows retail sales since 1992. This is monthly retail sales and food service, seasonally adjusted (total and ex-gasoline). Retail sales are up 28.7% from the bottom, and now 12.8% above the pre-recession peak (not inflation adjusted)
The consensus is for retail sales to be unchanged in September, and to increase 0.4% ex-autos.
Delayed: Producer Price Index for September. The consensus is for a 0.2% increase in producer prices (0.1% increase in core).
Delayed: Manufacturing and Trade: Inventories and Sales (business inventories) report for August. The consensus is for a 0.2% increase in inventories.


