by Calculated Risk on 11/06/2013 11:59:00 AM
Wednesday, November 06, 2013
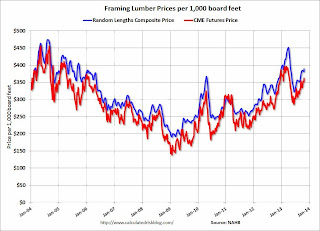
Framing Lumber Prices up 15% year-over-year
Here is another graph on framing lumber prices (as an indicator of building activity). Early this year I mentioned that lumber prices were nearing the housing bubble highs. Then prices started to decline sharply, with prices off over 25% from the highs by June.
The price increases early this year were due to demand (more housing starts) and supply constraints (framing lumber suppliers were working to bring more capacity online).
Prices have been increasing again since June (there is some seasonality to prices).
Currently prices are up about 15% year-over-year.
 Click on graph for larger image in graph gallery.
This graph shows two measures of lumber prices: 1) Framing Lumber from Random Lengths through last week (via NAHB), and 2) CME framing futures.
We will probably see another surge in prices early next year.


