by Calculated Risk on 2/04/2014 05:14:00 PM
Tuesday, February 04, 2014
Q4 2013 GDP Details on Residential and Commercial Real Estate
The BEA released the underlying details for the Q4 advance GDP report.
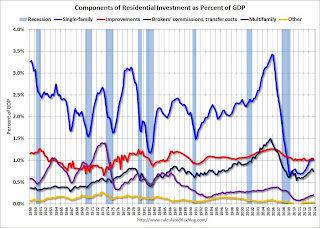
The first graph is for Residential investment (RI) components as a percent of GDP. According to the Bureau of Economic Analysis, RI includes new single family structures, multifamily structures, home improvement, Brokers’ commissions and other ownership transfer costs, and a few minor categories (dormitories, manufactured homes).
A few key points:
1) Usually the most important components are investment in single family structures followed by home improvement. However home improvement has been the top category for twenty one consecutive quarters, but that is about to change. Investment in single family structures should be the top category again soon.
2) Even though investment in single family structures has increased significantly from the bottom, single family investment is still very low - and still below the bottom for previous recessions. I expect further increases over the next few years.
3) Look at the contribution from Brokers’ commissions and other ownership transfer costs. This is the category mostly related to existing home sales (this is the contribution to GDP from existing home sales). If existing home sales are flat, or even decline due to fewer foreclosures, this will have little impact on total residential investment.
 Click on graph for larger image.
Investment in home improvement was at a $177 billion Seasonally Adjusted Annual Rate (SAAR) in Q4 (about 1.0% of GDP), still above the level of investment in single family structures of $174 billion (SAAR) (also 1.0% of GDP). Single family structure investment will probably overtake home improvement as the largest category of residential investment very soon.
The second graph shows investment in offices, malls and lodging as a percent of GDP. Office, mall and lodging investment has increased recently, but from a very low level.
Investment in offices is down about 53% from the recent peak (as a percent of GDP). There has been some increase in the Architecture Billings Index lately, so office investment might start to increase. However the office vacancy rate is still very high, so any increase in investment will probably be small.
 Investment in multimerchandise shopping structures (malls) peaked in 2007 and is down about 56% from the peak (note that investment includes remodels, so this will not fall to zero). The vacancy rate for malls is still very high, so investment will probably stay low for some time.
Lodging investment peaked at 0.31% of GDP in Q3 2008 and is down about 64%. With the hotel occupancy rate close to normal, it is possible that hotel investment will probably continue to increase.
These graphs show there is currently very little investment in offices, malls and lodging - but that investment is starting to increase. And residential investment is increasing, but from a very low level.


