by Calculated Risk on 8/31/2014 09:26:00 PM
Sunday, August 31, 2014
Mortgage Rates: A Long Way to Fall for a Significant Increase in Refinance Activity
I've seen some recent discussion suggesting that mortgage refinance activity might pickup significantly if mortgage rates fall just a little more. I think this is incorrect.
First, from Freddie Mac last week: Mortgage Rates Remain Low Heading Into Holiday Weekend
Freddie Mac ... released the results of its Primary Mortgage Market Survey® (PMMS®), showing average fixed mortgage rates largely unchanged amid mixed news on the housing front heading into the Labor Day weekend.
...
30-year fixed-rate mortgage (FRM) averaged 4.10 percent with an average 0.5 point for the week ending August 28, 2014, unchanged from last week. A year ago at this time, the 30-year FRM averaged 4.51 percent.
15-year FRM this week averaged 3.25 percent with an average 0.6 point, up from last week when it averaged 3.23 percent. A year ago at this time, the 15-year FRM averaged 3.54 percent.
 Click on graph for larger image.
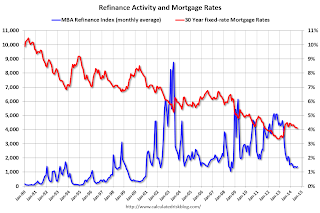
This graph shows the 30 year fixed rate mortgage interest rate from the Freddie Mac Primary Mortgage Market Survey® compared to the MBA refinance index.
The refinance index dropped sharply last year when mortgage rates increased. Historically refinance activity picks up significantly when mortgage rates fall about 50 bps from a recent level.
Sure, borrowers who took out mortgages last year can probably refinance now - but that is a small number of total borrowers. For a significant increase in refinance activity, rates would have to fall below the late 2012 lows (on a monthly basis, 30 year mortgage rates were at 3.35% in the PMMS in November and December 2012.
The second graph shows the relationship between the monthly 10 year Treasury Yield and 30 year mortgage rates from the Freddie Mac survey.
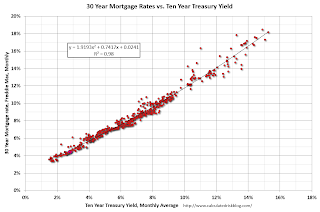 Currently the 10 year Treasury yield is at 2.34% and 30 year mortgage rates are at 4.10% (according to the Freddie Mac survey). Based on the relationship from the graph, the 30 year mortgage rate (Freddie Mac survey) would be around 3.5% when 10-year Treasury yields are around 1.4% (unlikely any time soon).
To really have a refinance boom, 10-year Treasury yields would have to fall to 1% or so!
So I don't expect a significant increase in refinance activity any time soon.
Restaurant Performance Index declined in July
by Calculated Risk on 8/31/2014 12:49:00 PM
From the National Restaurant Association: Restaurant Performance Index Dipped in July
Due in part to a dampened outlook among restaurant operators, the National Restaurant Association’s Restaurant Performance Index (RPI) registered a modest decline in July. The RPI – a monthly composite index that tracks the health of and outlook for the U.S. restaurant industry – stood at 101.0 in July, down from a level of 101.3 in June and the second consecutive monthly decline. Despite the recent downticks, the RPI remained above 100 for the 17th consecutive month, which signifies expansion in the index of key industry indicators.
“Although restaurant operators reported positive same-store sales and customer traffic results in July, the RPI edged down as a result of a mixed outlook for the months ahead,” said Hudson Riehle, senior vice president of the Research and Knowledge Group for the Association. “Restaurant operators were less bullish about the direction of the overall economy, and rising wholesale food costs are once again starting to pose a significant challenge.”
emphasis added
 Click on graph for larger image.
The index decreased to 101.0 in July, down from 101.3 in June. (above 100 indicates expansion).
Restaurant spending is discretionary, so even though this is "D-list" data, I like to check it every month. Even with the recent declines in the index, this is still a decent level.
Saturday, August 30, 2014
Schedule for Week of August 31st
by Calculated Risk on 8/30/2014 01:11:00 PM
This will be a busy week for economic data. The key report is the August employment report on Friday.
Other key reports include the ISM manufacturing index on Tuesday and August vehicle sales on Wednesday.
The ECB rate decision and press conference with ECB President Mario Draghi on Thursday will be closely watched.
All US markets will be closed in observance of the Labor Day holiday.
Early: Black Knight Mortgage Monitor report for July.
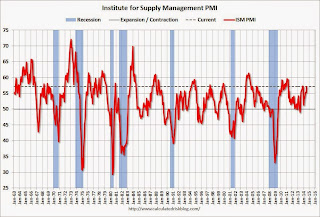 10:00 AM: ISM Manufacturing Index for August. The consensus is for a decrease to 56.8 from 57.1 in July.
Here is a long term graph of the ISM manufacturing index.
The ISM manufacturing index indicated expansion in July at 57.1%. The employment index was at 58.2%, and the new orders index was at 63.4%.
10:00 AM: Construction Spending for July. The consensus is for a 0.8% increase in construction spending.
7:00 AM: The Mortgage Bankers Association (MBA) will release the results for the mortgage purchase applications index.
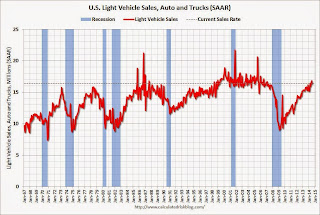 All day: Light vehicle sales for August. The consensus is for light vehicle sales to increase to 16.5 million SAAR in August from 16.4 million in July (Seasonally Adjusted Annual Rate).
This graph shows light vehicle sales since the BEA started keeping data in 1967. The dashed line is the June sales rate.
10:00 AM: Manufacturers' Shipments, Inventories and Orders (Factory Orders) for July. The consensus is for a 10.5% increase in July orders.
2:00 PM: Federal Reserve Beige Book, an informal review by the Federal Reserve Banks of current economic conditions in their Districts.
1:45 PM CET (7:45 AM ET): Press conference following the Governing Council meeting of the ECB in Frankfurt with Mario Draghi. Here is the ECB website and press conference page.
8:15 AM: The ADP Employment Report for August. This report is for private payrolls only (no government). The consensus is for 213,000 payroll jobs added in August, down from 218,000 in July.
8:30 AM: The initial weekly unemployment claims report will be released. The consensus is for claims to increase to 305 thousand from 298 thousand.
 8:30 AM: Trade Balance report for July from the Census Bureau.
 Imports decreased and exports increased in June.
The consensus is for the U.S. trade deficit to be at $42.7 billion in July from $41.5 billion in June.
10:00 AM: ISM non-Manufacturing Index for August. The consensus is for a reading of 57.1, down from 58.7 in July. Note: Above 50 indicates expansion.
8:30 AM: Employment Report for August. The consensus is for an increase of 210,000 non-farm payroll jobs added in August, up slightly from the 209,000 non-farm payroll jobs added in July.
The consensus is for the unemployment rate to decrease to 6.1% in August.
 This graph shows the year-over-year change in total non-farm employment since 1968.
In July, the year-over-year change was 2.570 million jobs, and it generally appears the pace of hiring is increasing.
Right now it looks possible that 2014 will be the best year since 1999 for both total nonfarm and private sector employment growth.
As always, a key will be the change in real wages - and as the unemployment rate falls, wage growth should eventually start to pickup.
Unofficial Problem Bank list declines to 439 Institutions
by Calculated Risk on 8/30/2014 08:33:00 AM
This is an unofficial list of Problem Banks compiled only from public sources.
Here is the unofficial problem bank list for Aug 29, 2014.
Changes and comments from surferdude808:
As expected, the FDIC released q2 industry results and provided an update on its latest enforcement action activity. The update led to six removals from the Unofficial Problem Bank List pushing the list total down to 439 institutions with assets of $139.97 billion. A year ago, the list held 707 institutions with assets of $250.6 billion.CR Note: The FDIC's official problem bank list is comprised of banks with a CAMELS rating of 4 or 5, and the list is not made public. (CAMELS is the FDIC rating system, and stands for Capital adequacy, Asset quality, Management, Earnings, Liquidity and Sensitivity to market risk. The scale is from 1 to 5, with 1 being the strongest.)
Actions were terminated against First State Bank, Lonoke, AR ($256 million); The Business Bank, Appleton, WI ($253 million); First Financial Bank, Bessemer, AL ($183 million); Citizens State Bank, Hudson, WI ($146 million); South Georgia Bank, Glennville, GA ($125 million); and Golden State Bank, Upland, CA ($92 million Ticker: GSBB).
The FDIC told there are 354 institutions with assets of $110 billion on the Official Problem Bank List. Since their last update, the official list declined by 13.9 percent or 57 institutions, which the largest percentage decline over the past 13 quarters since the official list peaked at 888 institutions in the first quarter of 2011. The unofficial list fell by an identical 57 institutions since the last update from the FDIC on May 28, 2014.
As a substitute for the CAMELS ratings, surferdude808 is using publicly announced formal enforcement actions, and also media reports and company announcements that suggest to us an enforcement action is likely, to compile a list of possible problem banks in the public interest.
When the list was increasing, the official and "unofficial" counts were about the same. Now with the number of problem banks declining, the unofficial list is lagging the official list. This probably means regulators are changing the CAMELS rating on some banks before terminating the formal enforcement actions.
Friday, August 29, 2014
Merrill and Goldman Forecasts for August Non-Farm Payrolls
by Calculated Risk on 8/29/2014 08:22:00 PM
The August employment report will be released next Friday, September 5th and the consensus is that 210 thousand payroll jobs were added in August. Here are two forecasts:
From economist Kris Dawsey at Goldman Sachs:
Employment indicators have strengthened a bit in August vs. July, including the employment components of the available service sector surveys, the Conference Board labor differential, and initial jobless claims. Our preliminary forecast for August payroll job growth is 240k, with the important caveat that we have yet to receive a few key pieces of data for the month, most notably the ISM nonmanufacturing report. ... With no special factors on weather, strikes, unusual composition in the prior month, fiscal policy issues, or obvious seasonal distortions, we think the August report should be a fairly “clean read” on the likely-strengthening underlying trend. We also anticipate a downtick of one-tenth in the unemployment rate to 6.1%, matching its prior cycle low set two months back. Should the participation rate give up its small July increase, the risk is skewed toward 6.0%, in our view.From Merrill Lynch:
The August employment report is likely to be healthy with nonfarm payroll growth of 245,000 and a decline in the unemployment rate to 6.1% from 6.2%. ... Early indicators of the labor market have all been encouraging with the conference board labor differential narrowing to -12.4% as an increase in respondents believe jobs have become plentiful. Initial jobless claims have remained low, hovering around 300,000, consistent with little firing. Moreover, manufacturing job growth should be strong as suggested by healthy surveys and recent industrial production data.
We expect the unemployment rate to fall back to 6.1%, reversing the increase last month.
Fannie Mae: Mortgage Serious Delinquency rate declined to 2.0% in July, Lowest since October 2008
by Calculated Risk on 8/29/2014 04:10:00 PM
Fannie Mae reported today that the Single-Family Serious Delinquency rate declined in July to 2.00% from 2.05% in June. The serious delinquency rate is down from 2.70% in July 2013, and this is the lowest level since October 2008.
The Fannie Mae serious delinquency rate peaked in February 2010 at 5.59%.
Earlier this week, Freddie Mac reported that the Single-Family serious delinquency rate declined in July to 2.02% from 2.07% in June. Freddie's rate is down from 2.70% in July 2013, and is at the lowest level since January 2009. Freddie's serious delinquency rate peaked in February 2010 at 4.20%.
Both Fannie and Freddie's serious delinquency rates will probably be below 2% in August.
Note: These are mortgage loans that are "three monthly payments or more past due or in foreclosure".

The Fannie Mae serious delinquency rate has fallen 0.70 percentage points over the last year, and at that pace the serious delinquency rate will be under 1% in early 2016.
Note: The "normal" serious delinquency rate is under 1%.
Maybe serious delinquencies will be close to normal in 2016.
Hotels: Occupancy up 5%, RevPAR up 11.0% Year-over-Year
by Calculated Risk on 8/29/2014 02:06:00 PM
From HotelNewsNow.com: STR: US results for week ending 23 August
The U.S. hotel industry recorded positive results in the three key performance measurements during the week of 17-23 August 2014, according to data from STR.Note: ADR: Average Daily Rate, RevPAR: Revenue per Available Room.
In year-over-year measurements, the industry’s occupancy rate rose 5.0 percent to 70.6 percent. Average daily rate increased 5.4 percent to finish the week at US$116.13. Revenue per available room for the week was up 10.7 percent to finish at US$82.04.
emphasis added
The occupancy rate has peaked for the year.
The following graph shows the seasonal pattern for the hotel occupancy rate using the four week average.
 Click on graph for larger image.
The red line is for 2014, blue is the median, and black is for 2009 - the worst year since the Great Depression for hotels. Purple is for 2000.
The 4-week average of the occupancy rate is solidly above the median for 2000-2007, and is slightly above the level for the same week in 2000 (the previous high).
Right now it looks like 2014 will be the best year since 2000 for hotels. Since it takes some time to plan and build hotels, I expect 2015 will be a record year for hotel occupancy. Note: Smith Travel analysts say that supply growth will pickup next year, but remain relatively slow, "hotel supply growth in the United States is forecast to be 1% this year and 1.3% in 2015".
Data Source: Smith Travel Research, Courtesy of HotelNewsNow.com
August Consumer Sentiment increases to 82.5
by Calculated Risk on 8/29/2014 09:59:00 AM
Click on graph for larger image.
The final Reuters / University of Michigan consumer sentiment index for August was at 82.5, up from the preliminary reading of 79.2, and up from 81.8 in July.
This was above the consensus forecast of 80.3. Sentiment has generally been improving following the recession - with plenty of ups and downs - and a big spike down when Congress threatened to "not pay the bills" in 2011.
Personal Income increased 0.2% in July, Spending decreased 0.1%
by Calculated Risk on 8/29/2014 08:41:00 AM
The BEA released the Personal Income and Outlays report for July:
Personal income increased $28.6 billion, or 0.2 percent ... in July, according to the Bureau of Economic Analysis. Personal consumption expenditures (PCE) decreased $13.6 billion, or 0.1 percent.The following graph shows real Personal Consumption Expenditures (PCE) through July 2014 (2009 dollars). Note that the y-axis doesn't start at zero to better show the change.
...
Real PCE -- PCE adjusted to remove price changes -- decreased 0.2 percent in July, in contrast to an increase of 0.2 percent in June. ... The price index for PCE increased 0.1 percent in July, compared with an increase of 0.2 percent in June. The PCE price index, excluding food and energy, increased 0.1 percent in July, the same increase as in June.
 Click on graph for larger image.
The dashed red lines are the quarterly levels for real PCE.
PCE is off to a slow start in Q3. NOTE: Graph corrected.
On inflation: The PCE price index increased 1.6 percent year-over-year, and at a 1.0% annualized rate in July. The core PCE price index (excluding food and energy) increased 1.5 percent year-over-year in July, and at a 1.1% annualized rate in July.
Thursday, August 28, 2014
Friday: Personal Income and Outlays, Chicago PMI, Consumer Sentiment
by Calculated Risk on 8/28/2014 07:46:00 PM
Friday:
• At 8:30 AM ET, Personal Income and Outlays for July. The consensus is for a 0.3% increase in personal income, and for a 0.1% increase in personal spending. And for the Core PCE price index to increase 0.2%.
• At 9:45 AM, the Chicago Purchasing Managers Index for August. The consensus is for an increase to 56.0, up from 52.6 in July.
• At 9:55 AM, the Reuter's/University of Michigan's Consumer sentiment index (final for August). The consensus is for a reading of 80.3, up from the preliminary reading of 79.2, and down from the July reading of 82.5.
And on the GDP revision from the BEA: Gross Domestic Product, Second Quarter 2014 (Second Estimate); Corporate Profits, Second Quarter 2014 (Preliminary Estimate)
Real gross domestic product -- the output of goods and services produced by labor and property located in the United States -- increased at an annual rate of 4.2 percent in the second quarter of 2014, according to the "second" estimate released by the Bureau of Economic Analysis. In the first quarter, real GDP decreased 2.1 percent.Here is a Comparison of Second and Advance Estimates.
The GDP estimate released today is based on more complete source data than were available for the "advance" estimate issued last month. In the advance estimate, the increase in real GDP was 4.0 percent. With this second estimate for the second quarter, the general picture of economic growth remains the same; the increase in nonresidential fixed investment was larger than previously estimated, while the increase in private inventory investment was smaller than previously estimated
Below is a table comparing the contributions to the percent change for a few categories. Less inventory, more investment ... a positive.
| Revision: Contributions to Percent Change in Real Gross Domestic Product | |||
|---|---|---|---|
| Advance | 2nd Release | Revision | |
| GDP, Percent change at annual rate: | 4.0 | 4.2 | 0.2 |
| PCE, Percentage points at annual rates: | |||
| Personal consumption expenditures | 1.69 | 1.69 | 0.0 |
| Investment, Percentage points at annual rates: | |||
| Nonresidential Structures | 0.15 | 0.26 | 0.11 |
| Equipment | 0.40 | 0.59 | 0.19 |
| Intellectual property products | 0.14 | 0.17 | 0.03 |
| Residential | 0.23 | 0.22 | -.01 |
| Change in private inventories | 1.66 | 1.39 | -0.27 |
| Trade, Percentage points at annual rates: | |||
| Net exports of goods and services | -0.61 | -0.43 | 0.18 |
| Government, Percentage points at annual rates: | |||
| Federal Government | -0.05 | -0.06 | -0.01 |
| State and Local | 0.35 | 0.33 | -0.02 |
Regional Manufacturing Surveys suggest Solid August ISM index
by Calculated Risk on 8/28/2014 02:15:00 PM
From the Kansas City Fed: Growth in Tenth District Manufacturing Activity Slowed Slightly
The Federal Reserve Bank of Kansas City released the August Manufacturing Survey today. According to Chad Wilkerson, vice president and economist at the Federal Reserve Bank of Kansas City, the survey revealed that growth in Tenth District manufacturing activity slowed slightly, but producers’ expectations for future activity remained solid.Here is a graph comparing the regional Fed surveys and the ISM manufacturing index:
“Growth eased a bit from last month’s pace,” Wilkerson said. “Still, August represented the eighth straight month of expansion in the region, and plant managers remained generally optimistic.”
...
The month-over-month composite index was 3 in August, down from 9 in July and 6 in June. The composite index is an average of the production, new orders, employment, supplier delivery time, and raw materials inventory indexes.
 Click on graph for larger image.
The New York and Philly Fed surveys are averaged together (dashed green, through August), and five Fed surveys are averaged (blue, through August) including New York, Philly, Richmond, Dallas and Kansas City. The Institute for Supply Management (ISM) PMI (red) is through July (right axis).
All of the regional surveys showed expansion in August, and it seems likely the ISM index will be in mid-to-high 50 range again this month. The ISM index for August will be released Tuesday, September 2nd.
FDIC: Earnings increased for insured institutions, Fewer Problem banks, Residential REO Declines in Q2
by Calculated Risk on 8/28/2014 11:16:00 AM
The FDIC released the Quarterly Banking Profile for Q2 today.
Commercial banks and savings institutions insured by the Federal Deposit Insurance Corporation (FDIC) reported aggregate net income of $40.2 billion in the second quarter of 2014, up $2.0 billion (5.3 percent) from earnings of $38.2 billion the industry reported a year earlier. The increase in earnings was mainly attributable to a $1.9 billion (22.4 percent) decline in loan-loss provisions and a $1.5 billion (1.4 percent) decline in noninterest expenses. Also, strong loan growth contributed to an increase in net interest income compared to a year ago. However, lower income from reduced mortgage activity and a drop in trading revenue contributed to a year-over-year decline in noninterest income.The FDIC reported the number of problem banks declined:
...
"We saw further improvement in the banking industry during the second quarter," FDIC Chairman Martin J. Gruenberg said. "Net income was up, asset quality improved, loan balances grew at their fastest pace since 2007, and loan growth was broad-based across institutions and loan types. We also saw a large decline in the number of problem banks. However, challenges remain. Industry revenue has been under pressure from narrow net interest margins and lower mortgage-related income. Institutions have been extending asset maturities, which is raising concerns about interest-rate risk. And banks have been increasing higher-risk loans to leveraged commercial borrowers. These issues are matters of ongoing supervisory attention. Nonetheless, on balance, results from the second quarter reflect a stronger banking industry and stronger community banks."
emphasis added
he number of "problem banks" fell for the 13th consecutive quarter. The number of banks on the FDIC's "Problem List" declined from 411 to 354 during the quarter. The number of "problem" banks now is 60 percent below the post-crisis high of 888 at the end of the first quarter of 2011. Seven FDIC-insured institutions failed in the second quarter, compared to 12 in the second quarter of 2013.
 Click on graph for larger image.
The dollar value of 1-4 family residential Real Estate Owned (REOs, foreclosure houses) declined from $6.57 billion in Q1 2014 to $6.22 billion in Q2. This is the lowest level of REOs since Q3 2007. Even in good times, the FDIC insured institutions have about $2.5 billion in residential REO.
This graph shows the dollar value of Residential REO for FDIC insured institutions. Note: The FDIC reports the dollar value and not the total number of REOs.
NAR: Pending Home Sales Index increased 3.3% in July, down 2.1% year-over-year
by Calculated Risk on 8/28/2014 10:03:00 AM
From the NAR: Pending Home Sales Pick Up in July
The Pending Home Sales Index, a forward-looking indicator based on contract signings, climbed 3.3 percent to 105.9 in July from 102.5 in June, but is still 2.1 percent below July 2013 (108.2). The index is at its highest level since August 2013 (107.1) and is above 100 – considered an average level of contract activity – for the third consecutive month.Note: Contract signings usually lead sales by about 45 to 60 days, so this would usually be for closed sales in August and September.
...
The PHSI in the Northeast jumped 6.2 percent to 89.2 in July, and is 8.3 percent above a year ago. In the Midwest the index marginally fell 0.4 percent to 104.6 in July, and is 6.4 percent below July 2013.
Pending home sales in the South increased 4.2 percent to an index of 119.0 in July, and is now 1.0 percent below a year ago. The index in the West rose 4.0 percent in July to 99.5, but remains 6.0 percent below July 2013.
Weekly Initial Unemployment Claims decrease to 298,000
by Calculated Risk on 8/28/2014 08:33:00 AM
The DOL reports:
In the week ending August 23, the advance figure for seasonally adjusted initial claims was 298,000, a decrease of 1,000 from the previous week's revised level. The previous week's level was revised up by 1,000 from 298,000 to 299,000. The 4-week moving average was 299,750, a decrease of 1,250 from the previous week's revised average. The previous week's average was revised up by 250 from 300,750 to 301,000.The previous week was revised up to 299,000.
There were no special factors impacting this week's initial claims.
The following graph shows the 4-week moving average of weekly claims since January 1971.
 Click on graph for larger image.
The dashed line on the graph is the current 4-week average. The four-week average of weekly unemployment claims decreased to 299,750.
This was close to the consensus forecast of 300,000.
Wednesday, August 27, 2014
A comment from Tom Lawler on Household Estimates; Thursday: Unemployment Claims, Q2 GDP (2nd estimate), Pending Home Sales
by Calculated Risk on 8/27/2014 07:44:00 PM
CR Note: Many analysts and reporters use Census data to estimate ongoing household formation. They are ignoring severe problems with the Census estimates ... from housing economist Tom Lawler:
For well over a decade I have been trying to get Census to explain the widely different estimates of households from different surveys. In a 2004 "summit" that I hosted at Fannie Mae, I asked Census officials "what household number from a time series perspective should analysts use as the best estimate from Census?" The answer I got a decade a go was, "that's a good question." Read the attached.Thursday:
Household Estimates Conundrum: Effort to Develop More Consistent Household Estimates Across Surveys
And here is the conclusion section from the above.
We have an obligation to our data users to provide clear, unambiguous explanations and guidance about the estimates we provide on households (occupied housing units). In our role as the "leading source of quality data about the Nation’s people and economy," we ultimately should be able to:It's been a long slog ...
1. Develop a common methodology that produces reasonably consistent estimates of households (and, therefore, vacant housing units) across our current surveys,
2. Develop a common methodology that may still produce noticeable differences but still be able to explain differences and recommend a preferred estimate, or
3. Be able to explain why we cannot develop a common methodology and be able to explain the differences and provide guidance about the agency’s preferred estimate of households (occupied housing units) for the United States.
• At 8:30 AM ET, the initial weekly unemployment claims report will be released. The consensus is for claims to increase to 300 thousand from 298 thousand.
• Also at 8:30 AM, Gross Domestic Product, 2nd quarter 2014 (second estimate). The consensus is that real GDP increased 4.0% annualized in Q2, unchanged from 4.0% in the advance estimate.
• At 10:00 AM, the Pending Home Sales Index for July. The consensus is for a 0.5% increase in the index.
• At 11:00 AM, the Kansas City Fed manufacturing survey for August. This is the last of the Fed regional surveys for August.
Average 30 Year Fixed Mortgage Rates decline to 4.11%, No "Refi Boom" in Sight
by Calculated Risk on 8/27/2014 04:27:00 PM
I use the weekly Freddie Mac Primary Mortgage Market Survey® (PMMS®) to track mortgage rates. The PMMS series started in 1971, so there is a fairly long historical series.
For daily rates, the Mortgage News Daily has a series that tracks the PMMS very well, and is usually updated daily around 4 PM ET. The MND data is based on actual lender rate sheets, and is mostly "the average no-point, no-origination rate for top-tier borrowers with flawless scenarios". (this tracks the Freddie Mac series).
MND reports that average 30 Year fixed mortgage rates declined today to 4.11% from 4.13% yesterday.
One year ago rates were at 4.61%, so rates are down 50 bps year-over-year.
I've mentioned before that mortgage refinancing tends to pickup when mortgage rates drop by about 50 bps from the recent levels. However rates were only at or above 4.60% for a short period - and many homeowners refi'd when rates were below 4% in 2012 and 2013. So I don't expect a "refi boom" right now.
Here is a table from Mortgage News Daily:
Freddie Mac: Mortgage Serious Delinquency rate declined in July, Lowest since January 2009
by Calculated Risk on 8/27/2014 12:36:00 PM
Freddie Mac reported that the Single-Family serious delinquency rate declined in July to 2.02% from 2.07% in June. Freddie's rate is down from 2.70% in July 2013, and this is the lowest level since January 2009. Freddie's serious delinquency rate peaked in February 2010 at 4.20%.
These are mortgage loans that are "three monthly payments or more past due or in foreclosure".
Note: Fannie Mae will report their Single-Family Serious Delinquency rate for July in a few days.

Although this indicates progress, the "normal" serious delinquency rate is under 1%.
The serious delinquency rate has fallen 0.68 percentage points over the last year - and at that rate of improvement, the serious delinquency rate will not be below 1% until early 2016.
Note: Very few seriously delinquent loans cure with the owner making up back payments - most of the reduction in the serious delinquency rate is from foreclosures, short sales, and modifications.
So even though distressed sales are declining, I expect an above normal level of Fannie and Freddie distressed sales for perhaps 2 more years (mostly in judicial foreclosure states).
CBO Projection: Budget Deficits in Future Years to be Smaller than Previous Forecast
by Calculated Risk on 8/27/2014 10:25:00 AM
The Congressional Budget Office (CBO) released new budget projections today An Update to the Budget and Economic Outlook: 2014 to 2024. The projected budget deficits have been reduced for most of the next ten years, although the projected deficit for 2014 has been revised up slightly (by $14 billion).
NOTE: In the previous update, the CBO revised down their projection of the deficit for fiscal 2014 from 3.7% to just under 2.9% of GDP.
From the CBO:
The federal budget deficit for fiscal year 2014 will amount to $506 billion, CBO estimates, roughly $170 billion lower than the shortfall recorded in 2013. At 2.9 percent of gross domestic product (GDP), this year's deficit will be much smaller than those of recent years (which reached almost 10 percent of GDP in 2009) and slightly below the average of federal deficits over the past 40 years.The CBO projects the deficit will decline further in 2015, and will be at or below 3% of GDP through fiscal 2019. Then the deficit will slowly increase.
...
CBO's current economic projections differ in some respects from the ones issued in February 2014. The agency has significantly lowered its projection of growth in real GDP for 2014, reflecting surprising economic weakness in the first half of the year. However, the level of real GDP over most of the coming decade is projected to be only modestly lower than estimated in February. In addition, CBO now anticipates lower interest rates throughout the projection period and a lower unemployment rate for the next six years.
emphasis added
 Click on graph for larger image.
This graph shows the actual (purple) budget deficit each year as a percent of GDP, and an estimate for the next ten years based on estimates from the CBO.
The CBO revised down their deficit projections for fiscal years 2017 through 2024.
MBA: Mortgage Applications Increase in Latest MBA Weekly Survey
by Calculated Risk on 8/27/2014 07:01:00 AM
From the MBA: Mortgage Applications Increase in Latest MBA Weekly Survey
Mortgage applications increased 2.8 percent from one week earlier, according to data from the Mortgage Bankers Association’s (MBA) Weekly Mortgage Applications Survey for the week ending August 22, 2014. ...
The Refinance Index increased 3 percent from the previous week. The seasonally adjusted Purchase Index increased 3 percent from one week earlier. ...
...
The average contract interest rate for 30-year fixed-rate mortgages with conforming loan balances ($417,000 or less) decreased to 4.28 percent from 4.29 percent, with points decreasing to 0.25 from 0.26 (including the origination fee) for 80 percent loan-to-value ratio (LTV) loans.
emphasis added
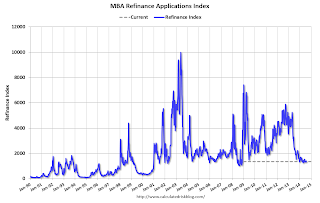 Click on graph for larger image.
The first graph shows the refinance index.
The refinance index is down 73% from the levels in May 2013.
As expected, refinance activity is very low this year.
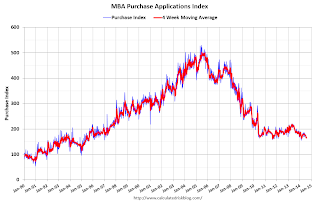 The second graph shows the MBA mortgage purchase index.
 According to the MBA, the unadjusted purchase index is down about 11% from a year ago.
Tuesday, August 26, 2014
Zillow: Case-Shiller House Price Index expected to slow further year-over-year in July
by Calculated Risk on 8/26/2014 08:31:00 PM
The Case-Shiller house price indexes for June were released this morning. Zillow has started forecasting Case-Shiller a month early - and I like to check the Zillow forecasts since they have been pretty close.
From Zillow: Case-Shiller Slowdown Forecasted to Continue
The Case-Shiller data for June 2014 came out this morning, and based on this information and the July 2014 Zillow Home Value Index (ZHVI, released August 21), we predict that next month’s Case-Shiller data (July 2014) will show that the non-seasonally adjusted (NSA) 20-City Composite Home Price Index increased by 7.0 percent and the NSA 10-City Composite Home Price Index increased by 6.9 percent on a year-over-year basis. The seasonally adjusted (SA) month-over-month change from June to July will be 0.1 percent for the 20-City Composite Index and flat for the 10-City Composite Home Price Index (SA). All forecasts are shown in the table below. Officially, the Case-Shiller Composite Home Price Indices for July will not be released until Tuesday, September 30.So the Case-Shiller index will probably show a lower year-over-year gain in July than in June (8.1% year-over-year).
| Zillow July 2014 Forecast for Case-Shiller Index | |||||
|---|---|---|---|---|---|
| Case Shiller Composite 10 | Case Shiller Composite 20 | ||||
| NSA | SA | NSA | SA | ||
| Case Shiller (year ago) | July 2013 | 176.39 | 172.88 | 162.38 | 158.96 |
| Case-Shiller (last month) | June 2014 | 187.19 | 185.57 | 172.33 | 170.69 |
| Zillow Forecast | YoY | 6.9% | 6.9% | 7.0% | 7.0% |
| MoM | 0.7% | 0.0% | 0.8% | 0.1% | |
| Zillow Forecasts1 | 188.5 | 185.2 | 173.7 | 170.5 | |
| Current Post Bubble Low | 146.45 | 149.91 | 134.07 | 137.13 | |
| Date of Post Bubble Low | Mar-12 | Jan-12 | Mar-12 | Jan-12 | |
| Above Post Bubble Low | 28.7% | 23.5% | 29.6% | 24.3% | |
| 1Estimate based on Year-over-year and Month-over-month Zillow forecasts | |||||
A few comments on the Seasonal Pattern for House Prices
by Calculated Risk on 8/26/2014 04:45:00 PM
• Starting this month, S&P is releasing the Case-Shiller National Index on a monthly basis. This probably means most reporting of a "headline number" will be switched from the Case-Shiller Composite 20 to the National Index.
• On a method to improve the seasonal factors, see Trulia chief economist Jed Kolko's article "Let’s Improve, Not Ignore, Seasonal Adjustment of Housing Data"
There has always been a clear seasonal pattern for house prices, but the seasonal differences have been more pronounced since the housing bust.
Even in normal times house prices tend to be stronger in the spring and early summer than in the fall and winter. Recently there has been a larger than normal seasonal pattern mostly because conventional sales are following the normal pattern (more sales in the spring and summer), but distressed sales (foreclosures and short sales) happen all year. So distressed sales have had a larger negative impact on prices in the fall and winter.
Note: I was one of several people to question the change in the seasonal factor (here is a post in 2009) - and this led to S&P Case-Shiller questioning the seasonal factor too (from April 2010).

This graph shows the month-to-month change in the CoreLogic and NSA Case-Shiller National index since 1987 (both through Jnue). The seasonal pattern was smaller back in the '90s and early '00s, and increased since the bubble burst.
It appears we've already seen the strongest month this year (NSA) for both Case-Shiller NSA and CoreLogic. This suggests both indexes will turn negative seasonally (NSA) earlier this year than the previous two years - perhaps in the August reports.
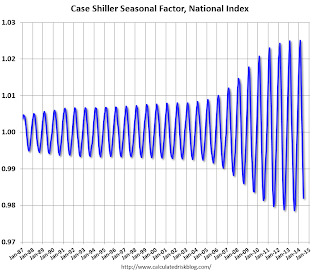
It appears the seasonal factor has started to decrease, and I expect that over the next several years - as the percent of distressed sales declines further and recent history is included in the factors - the seasonal factors will move back towards more normal levels (Kolko's article has more on this).
Zillow: Negative Equity declines further in Q2 2014
by Calculated Risk on 8/26/2014 02:11:00 PM
From Zillow: High Negative Equity Causing Generational Housing Gridlock
According to the second quarter Zillow Negative Equity Report, the national negative equity rate continued to decline in 2014 Q2, falling to 17 percent, down 14.4 percentage points from its peak (31.4 percent) in the first quarter of 2012. Negative equity has fallen for nine consecutive quarters as home values have risen. However, more than 8.7 million homeowners with a mortgage still remain underwaterThe following graph from Zillow shows negative equity by Loan-to-Value (LTV) in Q2 2014 compared to Q2 2013.
emphasis added
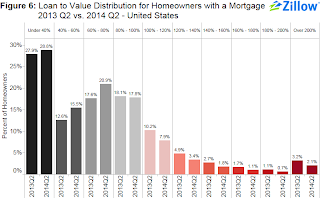 Click on graph for larger image.
From Zillow:
Figure 6 shows the loan-to-value (LTV) distribution for homeowners with a mortgage in 2014 Q2 versus 2013 Q2. The bulk of underwater homeowners, roughly 7.9 percent, are underwater by up to 20 percent of their loan value and will soon cross over into positive equity territory.Almost half of the borrowers with negative equity have a LTV of 100% to 120% (7.9% in Q2 2014). Most of these borrowers are current on their mortgages - and they have probably either refinanced with HARP or the loans are well seasoned (most of these properties were purchased in the 2004 through 2006 period, so borrowers have been current for eight years or so). In a few years, these borrowers will have positive equity.
The key concern is all those borrowers with LTVs above 140% (about 5.7% of properties with a mortgage according to Zillow). It will take many years to return to positive equity ... and a large percentage of these properties will eventually be distressed sales (short sales or foreclosures).
Note: CoreLogic will release their Q2 negative equity report in the next couple of weeks. For Q1, CoreLogic reported there were 6.3 million properties with negative equity, and that will be down further in Q2 2014.
House Prices: Better Seasonal Adjustment; Real Prices and Price-to-Rent Ratio Decline in June
by Calculated Risk on 8/26/2014 11:22:00 AM
This morning, S&P reported that the Composite 20 index declined 0.2% in June seasonally adjusted. However, it appears the seasonal adjustment has been distorted by the high level of distressed sales in recent years. Trulia's Jed Kolko wrote last month: "Let’s Improve, Not Ignore, Seasonal Adjustment of Housing Data"
The housing crisis substantially changed the seasonal pattern of housing activity: relative to conventional home sales, which peak in summer, distressed home sales are more evenly spread throughout the year and sell at a discount. As a result, in years when distressed sales constitute a larger share of overall sales, the seasonal swings in home prices get bigger while the seasonal swings in sales volumes get smaller.
Sharply changing seasonal patterns create problems for seasonal adjustment methods, which typically estimate seasonal adjustment factors by averaging several years’ worth of observed seasonal patterns. A sharp but ultimately temporary change in the seasonal pattern for housing activity affects seasonal adjustment factors more gradually and for more years than it should. Despite the recent normalizing of the housing market, seasonal adjustment factors are still based, in part, on patterns observed at the height of the foreclosure crisis, causing home price indices to be over-adjusted in some months and under-adjusted in others.
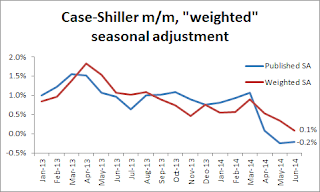 Kolko proposed a better seasonal adjustment:
This graph from Kolko shows the weighted seasonal adjustment (see Kolko's article for a description of his method). Kolko calculates that prices increased 0.1% on a weighted seasonal adjustment basis in June.
I've been expecting a slowdown in year-over-year prices as "For Sale" inventory increases, and the slowdown is here! The Case-Shiller Composite 20 index was up 8.1% year-over-year in June; the smallest year-over-year increase since December 2012.
This is still a very strong year-over-year change, but on a seasonally adjusted monthly basis, the Case-Shiller Composite 20 index was down 0.2% in June (the second monthly decline in a row), and on a weighted seasonal adjusted basis (Kolko's method), the Composite 20 index was only up 0.1% in June. This suggests price increases have slowed sharply in recent months.
On a real basis (inflation adjusted), prices actually declined for the third consecutive month. The price-rent ratio also declined in June for the Case-Shiller Composite 20 index.
It is important to look at prices in real terms (inflation adjusted). Case-Shiller, CoreLogic and others report nominal house prices. As an example, if a house price was $200,000 in January 2000, the price would be close to $280,000 today adjusted for inflation (40%). That is why the second graph below is important - this shows "real" prices (adjusted for inflation).
Nominal House Prices
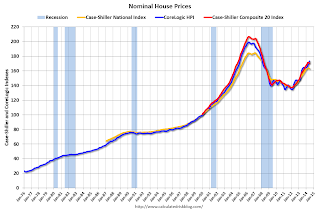 The first graph shows the monthly Case-Shiller National Index SA, and the Case-Shiller Composite 20 SA and CoreLogic House Price Indexes (through June) in nominal terms as reported.
In nominal terms, the Case-Shiller National index (SA) is back to early 2005 levels (and also back up to July 2008), and the Case-Shiller Composite 20 Index (SA) is back to September 2004 levels, and the CoreLogic index (NSA) is back to January 2005.
Real House Prices
 The second graph shows the same three indexes in real terms (adjusted for inflation using CPI less Shelter). Note: some people use other inflation measures to adjust for real prices.
In real terms, the National index is back to June 2002 levels, the Composite 20 index is back to July 2002, and the CoreLogic index back to February 2003.
In real terms, house prices are back to early '00s levels.
Price-to-Rent
In October 2004, Fed economist John Krainer and researcher Chishen Wei wrote a Fed letter on price to rent ratios: House Prices and Fundamental Value. Kainer and Wei presented a price-to-rent ratio using the OFHEO house price index and the Owners' Equivalent Rent (OER) from the BLS.
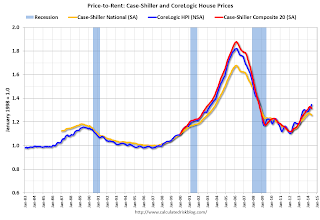 Here is a similar graph using the Case-Shiller National, Composite 20 and CoreLogic House Price Indexes.
This graph shows the price to rent ratio (January 1998 = 1.0).
On a price-to-rent basis, the Case-Shiller National index is back to January 2003 levels, the Composite 20 index is back to October 2002 levels, and the CoreLogic index is back to June 2003.
In real terms, and as a price-to-rent ratio, prices are mostly back to early 2000 levels. And real prices (and the price-to-rent ratio) have declined for three consecutive months using Case-Shiller National and Comp 20 indexes.
Case-Shiller: Comp 20 House Prices increased 8.1% year-over-year in June
by Calculated Risk on 8/26/2014 09:17:00 AM
S&P/Case-Shiller released the monthly Home Price Indices for June ("June" is a 3 month average of April, May and June prices).
This release includes prices for 20 individual cities, and two composite indices (for 10 cities and 20 cities) and the National index.
Note: Case-Shiller reports Not Seasonally Adjusted (NSA), I use the SA data for the graphs.
From S&P: Wide Spread Slowdown in Home Price Gains According to the S&P/Case-Shiller Home Price Indices
Data through June 2014, released today by S&P Dow Jones Indices for its S&P/Case-Shiller1 Home Price Indices ... show a sustained slowdown in price increases. The National Index gained 6.2% in the 12 months ending June 2014 while the 10-City and 20-City Composites gained 8.1%; all three indices saw their rates slow considerably from last month. Every city saw its year-over-year return worsen.
The National Index, now being published monthly, gained 0.9% in June. The 10- and 20-City Composites increased 1.0%. New York led the cities with a return of 1.6% and recorded its largest increase since June 2013. Chicago, Detroit and Las Vegas followed at +1.4%. Las Vegas posted its largest monthly gain since last summer. ...
“Home price gains continue to ease as they have since last fall,” says David M. Blitzer, Chairman of the Index Committee at S&P Dow Jones Indices. “For the first time since February 2008, all cities showed lower annual rates than the previous month."
 Click on graph for larger image.
 The first graph shows the nominal seasonally adjusted Composite 10 and Composite 20 indices (the Composite 20 was started in January 2000).
The Composite 10 index is off 18.2% from the peak, and down 0.1% in June (SA). The Composite 10 is up 23.8% from the post bubble low set in Jan 2012 (SA).
The Composite 20 index is off 17.4% from the peak, and down 0.2% (SA) in June. The Composite 20 is up 24.5% from the post-bubble low set in Jan 2012 (SA).
 The second graph shows the Year over year change in both indices.
The Composite 10 SA is up 8.1% compared to June 2013.
The Composite 20 SA is up 8.1% compared to June 2013.
Prices increased (SA) in 7 of the 20 Case-Shiller cities in June seasonally adjusted. (Prices increased in 20 of the 20 cities NSA) Prices in Las Vegas are off 42.7% from the peak, and prices in Denver and Dallas are at new highs (SA).
This was lower than the consensus forecast for a 8.4% YoY increase and suggests a further slowdown in price increases. I'll have more on house prices later.
Black Knight: Mortgage Loans in Foreclosure Process Lowest since March 2008
by Calculated Risk on 8/26/2014 08:01:00 AM
According to Black Knight's First Look report for July, the percent of loans delinquent decreased in July compared to June, and declined by 12% year-over-year.
Also the percent of loans in the foreclosure process declined further in July and were down 34% over the last year. Foreclosure inventory was at the lowest level since March 2008.
Black Knight reported the U.S. mortgage delinquency rate (loans 30 or more days past due, but not in foreclosure) was 5.64% in July, down from 5.70% in June. The normal rate for delinquencies is around 4.5% to 5%.
The percent of loans in the foreclosure process declined to 1.85% in July from 1.88% in June.
The number of delinquent properties, but not in foreclosure, is down 344,000 properties year-over-year, and the number of properties in the foreclosure process is down 471,000 properties year-over-year.
Black Knight will release the complete mortgage monitor for July in early September.
| Black Knight: Percent Loans Delinquent and in Foreclosure Process | ||||
|---|---|---|---|---|
| July 2014 | June 2014 | July 2013 | July 2012 | |
| Delinquent | 5.64% | 5.70% | 6.41% | 7.03% |
| In Foreclosure | 1.85% | 1.88% | 2.82% | 4.08% |
| Number of properties: | ||||
| Number of properties that are 30 or more, and less than 90 days past due, but not in foreclosure: | 1,713,000 | 1,728,000 | 1,846,000 | 1,960,000 |
| Number of properties that are 90 or more days delinquent, but not in foreclosure: | 1,136,000 | 1,155,000 | 1,347,000 | 1,650,000 |
| Number of properties in foreclosure pre-sale inventory: | 935,000 | 951,000 | 1,406,000 | 2,042,000 |
| Total Properties | 3,785,000 | 3,834,000 | 4,599,000 | 5,562,000 |
Monday, August 25, 2014
Tuesday: Durable Goods, Case-Shiller & FHFA House Prices, Richmond Fed Mfg Survey
by Calculated Risk on 8/25/2014 09:22:00 PM
From Gavyn Davies at the Financial Times: Draghi steals the show at Jackson Hole
The markets may read this as an empty threat, but they should note the importance of what [ECB President Mario Draghi] said about inflation expectations, which was added to the written text by the President himself on the day of the speech:Tuesday:
"Over the month of August, financial markets have indicated that inflation expectations exhibited significant declines at all horizons. The 5 year/5 year swap rate declined by 15 basis points to just below 2% … But if we go to shorter and medium-term horizons the revisions have been even more significant. The real [interest] rates on the short and medium term have gone up … The Governing Council will acknowledge these developments and within its mandate will use all the available instruments needed to ensure price stability over the medium term."This is much more explicit language about declining inflation expectations than anything the ECB has used in the past.
• At 8:30 AM ET, Durable Goods Orders for July from the Census Bureau. The consensus is for a 5.1% increase in durable goods orders. NOTE: The headline number could be huge because of a large number of aircraft orders in July.
• At 9:00 AM, S&P/Case-Shiller House Price Index for June. Although this is the June report, it is really a 3 month average of April, May and June. The consensus is for a 8.4% year-over-year increase in the Composite 20 index (NSA) for June. The Zillow forecast is for the Composite 20 to increase 8.1% year-over-year, and for prices to be unchanged month-to-month seasonally adjusted.
• Also at 9:00 AM, the FHFA House Price Index for June. This was original a GSE only repeat sales, however there is also an expanded index. The consensus is for a 0.3% increase.
• At 10:00 AM, the Conference Board's consumer confidence index for August. The consensus is for the index to decrease to 89.7 from 90.9.
• At 10:00 AM, the Richmond Fed Survey of Manufacturing Activity for August.
New Home Prices: 43% of Home over $300K, 8% under $150K
by Calculated Risk on 8/25/2014 04:54:00 PM
Here are two graphs I haven't posted for some time ...
As part of the new home sales report, the Census Bureau reported the number of homes sold by price and the average and median prices.
From the Census Bureau: "The median sales price of new houses sold in July 2014 was $269,800; the average sales price was $339,100. "
The following graph shows the median and average new home prices.

During the bust, the builders had to build smaller and less expensive homes to compete with all the distressed sales. With fewer distressed sales now, it appears the builders have moved to higher price points.
The average price in July 2014 was $339,100, and the median price was $269,800. Both are above the bubble high (this is due to both a change in mix and rising prices). The average is at an all time high.
The second graph shows the percent of new homes sold by price. At the peak of the housing bubble, almost 40% of new homes were sold for more than $300K - and over 20% were sold for over $400K.

And only 8% of homes sold were under $150K in July 2014. This is down from 30% in 2002 - and down from 20% as recently as August 2011. Quite a change.
Earlier on New Home Sales:
• New Home Sales at 412,000 Annual Rate in July
• Comments on New Home Sales
Comments on New Home Sales
by Calculated Risk on 8/25/2014 12:31:00 PM
The new home sales report for July was weak with sales at a 412,000 seasonally adjusted annual rate (SAAR), however combined with the upward revisions for the previous three months, total sales were somewhat above expectations. Sales for April, May and June were revised up a combined 33,000 sales SAAR.
The Census Bureau reported that new home sales this year, through July, were 266,000, Not seasonally adjusted (NSA). That is down 0.8% from 268,000 during the same period of 2013 (NSA). Basically flat compared to 2013.
Sales were up 12.3% year-over-year in July - but remember sales declined sharply in July 2013 as mortgage rates increased - so this was an easy comparison (I expect sales for July will be revised up too).

This graph shows new home sales for 2013 and 2014 by month (Seasonally Adjusted Annual Rate).
The comparisons to last year will be easy for the next couple of months, and I still expect to see year-over-year growth later this year.
And here is another update to the "distressing gap" graph that I first started posting several years ago to show the emerging gap caused by distressed sales. Now I'm looking for the gap to close over the next few years.

Following the housing bubble and bust, the "distressing gap" appeared mostly because of distressed sales.
I expect existing home sales to decline or move sideways (distressed sales will continue to decline and be partially offset by more conventional / equity sales). And I expect this gap to slowly close, mostly from an increase in new home sales.
Note: Existing home sales are counted when transactions are closed, and new home sales are counted when contracts are signed. So the timing of sales is different.
New Home Sales at 412,000 Annual Rate in July
by Calculated Risk on 8/25/2014 10:00:00 AM
The Census Bureau reports New Home Sales in July were at a seasonally adjusted annual rate (SAAR) of 412 thousand.
June sales were revised up from 406 thousand to 422 thousand, and May sales were revised up from 442 thousand to 454 thousand.
"Sales of new single-family houses in July 2014 were at a seasonally adjusted annual rate of 412,000, according to estimates released jointly today by the U.S. Census Bureau and the Department of Housing and Urban Development. This is 2.4 percent below the revised June rate of 422,000, but is 12.3 percent above the July 2013 estimate of 367,000."
 Click on graph for larger image.
The first graph shows New Home Sales vs. recessions since 1963. The dashed line is the current sales rate.
Even with the increase in sales over the previous two years, new home sales are still close to the bottom for previous recessions.
The second graph shows New Home Months of Supply.
 The months of supply increased in July to 6.0 months from 5.6 months in June.
 The all time record was 12.1 months of supply in January 2009.
This is now at the top of the normal range (less than 6 months supply is normal).
"The seasonally adjusted estimate of new houses for sale at the end of July was 205,000. This represents a supply of 6.0 months at the current sales rate."
 On inventory, according to the Census Bureau:
 "A house is considered for sale when a permit to build has been issued in permit-issuing places or work has begun on the footings or foundation in nonpermit areas and a sales contract has not been signed nor a deposit accepted."Starting in 1973 the Census Bureau broke this down into three categories: Not Started, Under Construction, and Completed.
The third graph shows the three categories of inventory starting in 1973.
The inventory of completed homes for sale is still low, and the combined total of completed and under construction is also low.
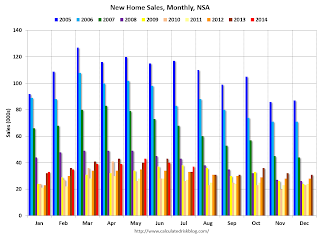 The last graph shows sales NSA (monthly sales, not seasonally adjusted annual rate).
In July 2014 (red column), 37 thousand new homes were sold (NSA). Last year 33 thousand homes were also sold in July. The high for July was 117 thousand in 2005, and the low for July was 26 thousand in 2010.
This was below expectations of 425,000 sales in July, and sales were up 12.3% year-over-year.
I'll have more later today .
Black Knight (formerly LPS): House Price Index up 0.8% in June, Up 5.5% year-over-year
by Calculated Risk on 8/25/2014 08:54:00 AM
Notes: I follow several house price indexes (Case-Shiller, CoreLogic, Black Knight, Zillow, FHFA, FNC and more). The timing of different house prices indexes can be a little confusing. Black Knight uses the current month closings only (not a three month average like Case-Shiller or a weighted average like CoreLogic), excludes short sales and REOs, and is not seasonally adjusted.
From Black Knight: U.S. Home Prices Up 0.8 Percent for the Month; Up 5.5 Percent Year-Over-Year
Today, the Data and Analytics division of Black Knight Financial Services released its latest Home Price Index (HPI) report, based on June 2014 residential real estate transactions. The Black Knight HPI combines the company’s extensive property and loan-level databases to produce a repeat sales analysis of home prices as of their transaction dates every month for each of more than 18,500 U.S. ZIP codes. The Black Knight HPI represents the price of non-distressed sales by taking into account price discounts for REO and short sales.The year-over-year increases have been getting steadily smaller for the last 9 months - as shown in the table below:
...
- Yearly increases in home appreciation continue to slow
- All 20 largest states and 40 largest metros again show month-over-month growth
- Nevada shows largest monthly gain among states, while Colorado and Texas continue to hit new highs
- Reno, Nev. home prices rise nearly 2 percent-- the most of any metropolitan area; Las Vegas still 42 percent off peak
| Month | YoY House Price Increase |
|---|---|
| Jan-13 | 6.7% |
| Feb-13 | 7.3% |
| Mar-13 | 7.6% |
| Apr-13 | 8.1% |
| May-13 | 7.9% |
| Jun-13 | 8.4% |
| Jul-13 | 8.7% |
| Aug-13 | 9.0% |
| Sep-13 | 9.0% |
| Oct-13 | 8.8% |
| Nov-13 | 8.5% |
| Dec-13 | 8.4% |
| Jan-14 | 8.0% |
| Feb-14 | 7.6% |
| Mar-14 | 7.0% |
| Apr-14 | 6.4% |
| May-14 | 5.9% |
| June-14 | 5.5% |
The Black Knight HPI is off 10.4% from the peak in June 2006 (not adjusted for inflation).
Note: The press release has data for the 20 largest states, and 40 MSAs.
Black Knight shows prices off 41.8% from the peak in Las Vegas, off 34.9% in Orlando, and 31.4% off from the peak in Riverside-San Bernardino, CA (Inland Empire). Prices are at new highs in Colorado and Texas (Denver, Austin, Dallas, Houston and San Antonio metros). Prices are also at new highs in San Jose, CA and in Nashville, TN.
Note: Case-Shiller for June will be released tomorrow.
Chicago Fed: "Index shows economic growth picked up in July"
by Calculated Risk on 8/25/2014 08:38:00 AM
The Chicago Fed released the national activity index (a composite index of other indicators): Index shows economic growth picked up in July
Led by improvements in production-related indicators, the Chicago Fed National Activity Index (CFNAI) rose to +0.39 in July from +0.21 in June. Three of the four broad categories of indicators that make up the index made positive contributions to the index in July, and two of the four categories increased from June.This graph shows the Chicago Fed National Activity Index (three month moving average) since 1967.
The index’s three-month moving average, CFNAI-MA3, increased to +0.25 in July from +0.16 in June, marking its fifth consecutive reading above zero. July’s CFNAI-MA3 suggests that growth in national economic activity was somewhat above its historical trend. The economic growth reflected in this level of the CFNAI-MA3 suggests limited inflationary pressure from economic activity over the coming year.
emphasis added
 Click on graph for larger image.
This suggests economic activity was above the historical trend in July (using the three-month average).
According to the Chicago Fed:
What is the National Activity Index? The index is a weighted average of 85 indicators of national economic activity drawn from four broad categories of data: 1) production and income; 2) employment, unemployment, and hours; 3) personal consumption and housing; and 4) sales, orders, and inventories.
A zero value for the index indicates that the national economy is expanding at its historical trend rate of growth; negative values indicate below-average growth; and positive values indicate above-average growth.
Sunday, August 24, 2014
Sunday: No Futures for You!
by Calculated Risk on 8/24/2014 08:31:00 PM
From CME Group: (ht Nemo)
UPDATE: Due to technical issues, CME Globex Markets remain halted. Updates will be provided as they become availableMonday:
• At 8:30 AM ET, the Chicago Fed National Activity Index for July. This is a composite index of other data.
• At 10:00 AM, New Home Sales for July from the Census Bureau. The consensus is for an increase in sales to 425 thousand Seasonally Adjusted Annual Rate (SAAR) in July from 406 thousand in June.
• At 10:30 AM, the Dallas Fed Manufacturing Survey for August.
Weekend:
• Schedule for Week of Aug 24th
Oil prices were down over the last week with WTI futures at $93.41 per barrel and Brent at $101.86 per barrel. A year ago, WTI was at $105, and Brent was at $111 - so prices are down about 10% year-over-year.
Below is a graph from Gasbuddy.com for nationwide gasoline prices. Nationally prices are around $3.43 per gallon (down about a dime from a year ago). If you click on "show crude oil prices", the graph displays oil prices for WTI, not Brent; gasoline prices in most of the U.S. are impacted more by Brent prices.
| Orange County Historical Gas Price Charts Provided by GasBuddy.com |
Vehicle Sales Forecasts: Over 16 Million SAAR again in August
by Calculated Risk on 8/24/2014 03:52:00 PM
The automakers will report August vehicle sales on Wednesday, Sept 3rd. Sales in July were at 16.40 million on a seasonally adjusted annual rate basis (SAAR), and it appears sales in August will be above 16 million SAAR again.
Note: There were 27 selling days in August this year compared to 28 last year.
Here are a couple of forecasts:
From J.D. Power: Summer Sizzle Continues as New-Vehicle Sales in August Forecast to Hit Highest Levels of the Year
Retail light-vehicle sales are projected to hit 1.3 million units and total light-vehicle sales are expected to reach nearly 1.5 million in August 2014, both a 3 percent increase on a selling day adjusted basis, compared with August 2013.From WardsAuto: Forecast: Strong Summer Sales to Continue in August
The seasonally adjusted annualized rate (SAAR) for retail sales in August 2014 is expected to be 13.6 million units, an increase of more than 100,000 units from the selling rate in July 2014. The August SAAR marks the sixth consecutive month where the SAAR has exceeded 13 million. Retail transactions are the most accurate measure of true underlying consumer demand for new vehicles. [Total sales forecast at 16.5 million SAAR]
John Humphrey, senior vice president of the global automotive practice at J.D. Power, notes that continued high levels of consumer expenditures on new vehicles demonstrate the continuation of the overall health of the industry.
“We expect consumer spending on new vehicles in August to approach $39 billion, the highest level on record for the month of August and second-highest month ever behind July 2005 ($39.7 billion),” said Humphrey. “The record consumer spending is fueled by both high sales volumes and high transaction prices.”
A new WardsAuto forecast calls for August U.S. light-vehicle sales to continue to gain ground on year-ago, as the industry seasonally adjusted annual rate stays in line with recent trend. The report calls for just under 1.51 million LV deliveries this month, equating to a daily sales rate of 55,761 units (over 27 days) – a 4.3% improvement over same-month year-ago (28 days). [Total sales forecast of 16.6 million SAAR]Another solid month for auto sales.


