by Calculated Risk on 8/26/2014 02:11:00 PM
Tuesday, August 26, 2014
Zillow: Negative Equity declines further in Q2 2014
From Zillow: High Negative Equity Causing Generational Housing Gridlock
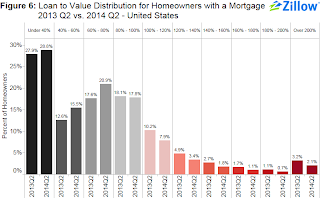
According to the second quarter Zillow Negative Equity Report, the national negative equity rate continued to decline in 2014 Q2, falling to 17 percent, down 14.4 percentage points from its peak (31.4 percent) in the first quarter of 2012. Negative equity has fallen for nine consecutive quarters as home values have risen. However, more than 8.7 million homeowners with a mortgage still remain underwaterThe following graph from Zillow shows negative equity by Loan-to-Value (LTV) in Q2 2014 compared to Q2 2013.
emphasis added
 Click on graph for larger image.
From Zillow:
Figure 6 shows the loan-to-value (LTV) distribution for homeowners with a mortgage in 2014 Q2 versus 2013 Q2. The bulk of underwater homeowners, roughly 7.9 percent, are underwater by up to 20 percent of their loan value and will soon cross over into positive equity territory.Almost half of the borrowers with negative equity have a LTV of 100% to 120% (7.9% in Q2 2014). Most of these borrowers are current on their mortgages - and they have probably either refinanced with HARP or the loans are well seasoned (most of these properties were purchased in the 2004 through 2006 period, so borrowers have been current for eight years or so). In a few years, these borrowers will have positive equity.
The key concern is all those borrowers with LTVs above 140% (about 5.7% of properties with a mortgage according to Zillow). It will take many years to return to positive equity ... and a large percentage of these properties will eventually be distressed sales (short sales or foreclosures).
Note: CoreLogic will release their Q2 negative equity report in the next couple of weeks. For Q1, CoreLogic reported there were 6.3 million properties with negative equity, and that will be down further in Q2 2014.


