by Calculated Risk on 9/30/2014 11:20:00 AM
Tuesday, September 30, 2014
A few comments on the Seasonal Pattern for House Prices
A few key points:
1) There is a clear seasonal pattern for house prices.
2) The surge in distressed sales during the housing bust distorted the seasonal pattern.
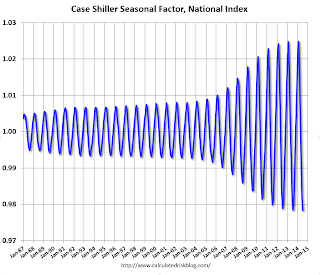
3) Even though distressed sales are down significantly, the seasonal factor is based on several years of data - and the factor is now overstating the seasonal change.
4) Still the seasonal index is probably a better indicator of actual price movements than the Not Seasonally Adjusted (NSA) index.
For in depth description of these issues, see Trulia chief economist Jed Kolko's article "Let’s Improve, Not Ignore, Seasonal Adjustment of Housing Data"
The housing crisis substantially changed the seasonal pattern of housing activity: relative to conventional home sales, which peak in summer, distressed home sales are more evenly spread throughout the year and sell at a discount. As a result, in years when distressed sales constitute a larger share of overall sales, the seasonal swings in home prices get bigger while the seasonal swings in sales volumes get smaller.Kolko proposed an improved seasonal adjustment. For July, the reported seasonally adjusted month-to-month change for the Composite 20 was -0.5%, but using Kolko's method prices were flat. For the National index, the reported change was +0.2%, and Kolko's method would yield 0.3%.
Sharply changing seasonal patterns create problems for seasonal adjustment methods, which typically estimate seasonal adjustment factors by averaging several years’ worth of observed seasonal patterns. A sharp but ultimately temporary change in the seasonal pattern for housing activity affects seasonal adjustment factors more gradually and for more years than it should. Despite the recent normalizing of the housing market, seasonal adjustment factors are still based, in part, on patterns observed at the height of the foreclosure crisis, causing home price indices to be over-adjusted in some months and under-adjusted in others.
Unfortunately, many have concluded that the solution to the problem of changing seasonal patterns is to downplay or ignore seasonally adjusted housing data until the foreclosure crisis is far enough in the past that it is no longer averaged into seasonal adjustment factors. Standard and Poor’s, publishers of the Case-Shiller home-price index, themselves warned in 2010 that “the unadjusted series is a more reliable indicator and, thus, reports should focus on the year-over-year changes where seasonal shifts are not a factor. Additionally, if monthly changes are considered, the unadjusted series should be used.” Even today, Case-Shiller home-price index press releases continue to emphasize non-seasonally-adjusted (NSA) changes over seasonally adjusted (SA) changes.
But ignoring seasonality during and after the foreclosure crisis is the opposite of what we should be doing. Changing seasonal patterns make seasonal adjustment more important.
Note: I was one of several people to question the change in the seasonal factor (here is a post in 2009) - and this led to S&P Case-Shiller questioning the seasonal factor too (from April 2010).
 Click on graph for larger image.
This graph shows the month-to-month change in the CoreLogic and NSA Case-Shiller National index since 1987 (both through July). The seasonal pattern was smaller back in the '90s and early '00s, and increased since the bubble burst.
It appears we've already seen the strongest month this year (NSA) for both Case-Shiller NSA and CoreLogic. This suggests both indexes will turn negative seasonally (NSA) earlier this year than the previous two years - perhaps in the August reports.
 The second graph shows the seasonal factors for the Case-Shiller National index since 1987. The factors started to change near the peak of the bubble, and really increased during the bust.
 It appears the seasonal factor has started to decrease, and I expect that over the next several years - as the percent of distressed sales declines further and recent history is included in the factors - the seasonal factors will move back towards more normal levels.
However, as Kolko noted, there will be a lag with the seasonal factor since it is based on several years of recent data.


