by Calculated Risk on 10/07/2014 08:49:00 AM
Tuesday, October 07, 2014
CoreLogic: House Prices up 6.4% Year-over-year in August
Notes: This CoreLogic House Price Index report is for August. The recent Case-Shiller index release was for July. The CoreLogic HPI is a three month weighted average and is not seasonally adjusted (NSA).
From CoreLogic: CoreLogic Reports Home Prices Rose by 6.4 Percent Year Over Year in August 2014
Home prices nationwide, including distressed sales, increased 6.4 percent in August 2014 compared to August 2013. This change represents 30 months of consecutive year-over-year increases in home prices nationally. On a month-over-month basis, home prices nationwide, including distressed sales, increased 0.3 percent in August 2014 compared to July 2014.
...
Excluding distressed sales, home prices nationally increased 5.9 percent in August 2014 compared to August 2013 and 0.3 percent month over month compared to July 2014. Also excluding distressed sales, 49 states and the District of Columbia showed year-over-year home price appreciation in August, with Mississippi being the only state to experience a year-over-year decline. ...
“The pace of year-over-year appreciation continues to slow down as real estate markets find more balance. Home price appreciation reached a peak of almost 12 percent year-over-year in October 2013 and has since subsided to the current pace of 6 percent,” said Mark Fleming, chief economist at CoreLogic. “Continued moderation of home price appreciation is a welcomed sign of more balanced real estate markets and less pressure on affordability for potential home buyers in the near future.”
emphasis added
 Click on graph for larger image.
 This graph shows the national CoreLogic HPI data since 1976. January 2000 = 100.
The index was up 0.3% in August, and is up 6.4% over the last year.
This index is not seasonally adjusted, and the index will probably turn negative month-to-month in September.
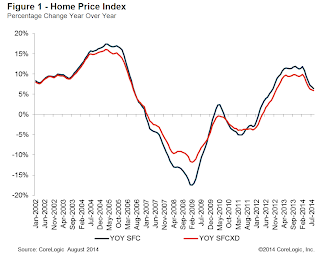
 The second graph is from CoreLogic. The year-over-year comparison has been positive for thirty consecutive months suggesting house prices bottomed early in 2012 on a national basis (the bump in 2010 was related to the tax credit).
The YoY increases continue to slow.
This index was up 8.2% YoY in May, 7.2% in June, 6.8% in July, and now 6.4% in August.


