From CoreLogic: CoreLogic Reports More Than Half of States At or Within 10 Percent of Pre-Crisis Home Price Peak
Home prices nationwide, including distressed sales, increased 6.1 percent in October 2014 compared to October 2013. This change represents 32 months of consecutive year-over-year increases in home prices nationally. On a month-over-month basis, home prices nationwide, including distressed sales, rose by 0.5 percent in October 2014 compared to September 2014.
...
Excluding distressed sales, home prices nationally increased 5.6 percent in October 2014 compared to October 2013 and 0.6 percent month over month compared to September 2014. Also excluding distressed sales, 49 states and the District of Columbia showed year-over-year home price appreciation in October, with Mississippi being the only state to experience a year-over-year decline (-1.2 percent). Distressed sales include short sales and real estate owned (REO) transactions. ...
“Home price growth is moderating as we head into the late fall and is currently running at half the pace it was in the spring of 2014,” said Sam Khater, deputy chief economist at CoreLogic. “However, there are still pockets of strength, especially in several Texas markets, as well as Seattle, Denver and other markets with strong economic fundamentals.”
emphasis added
 Click on graph for larger image.
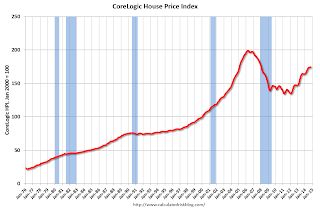
 This graph shows the national CoreLogic HPI data since 1976. January 2000 = 100.
The index was up 0.5% in October, and is up 6.1% over the last year.
This index is not seasonally adjusted, and this month-to-month increase was fairly strong during the seasonally weak period.
 The second graph is from CoreLogic. The year-over-year comparison has been positive for thirty two consecutive months suggesting house prices bottomed early in 2012 on a national basis (the bump in 2010 was related to the tax credit).
The YoY increases had been slowing, but picked up a little in October.