by Calculated Risk on 10/05/2015 11:36:00 AM
Monday, October 05, 2015
Reis: Mall Vacancy Rate unchanged in Q3
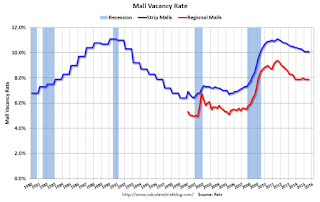
Reis reported that the vacancy rate for regional malls was unchanged at 7.9% in Q3 2015. This is down from a cycle peak of 9.4% in Q3 2011.
For Neighborhood and Community malls (strip malls), the vacancy rate was unchanged at 10.1% in Q3. For strip malls, the vacancy rate peaked at 11.1% in Q3 2011.
Comments from Reis Senior Economist and Director of Research Ryan Severino:
The national vacancy rate for neighborhood and community shopping centers was unchanged during the third quarter at 10.1%. The market is mired in this incredibly slow recovery whereby net absorption exceeds new supply, but not by a wide enough margin to cause vacancy to decline in a meaningful fashion. The vacancy rate for malls also was unchanged again at 7.9%, indicating that this issue is not just confined to one retail subsector.
So where is the demand? To be sure, the market is absorbing space, but not at the pace one would have hoped at this juncture in the cycle. A few things have transpired. First, space in the best centers leased up relatively quickly during this recovery and is largely gone. What remains to be leased is space that is a bit more challenging. Second, ecommerce, though not the leviathan that it is often portrayed to be, is not helping. Many services that people purchase online, such as apps, simply are not available for purchase in a physical store. Ecommerce slowly takes market share away from bricks‐and‐mortar buildings with every passing quarter. Third, the rise of different retail subtypes such as town centers, lifestyle centers, and power centers has given consumers options that they previously did not have. Does that mean we should expect structurally higher vacancy rates for the traditional retail subtypes? Likely yes. Those property subtypes are not likely to reach the same low vacancy rates during this cycle that they have attained in previous cycles. Although retail sales and demand for goods and services continues to increase, it is now spread through many more distribution channels than in the past.
 Click on graph for larger image.
This graph shows the strip mall vacancy rate starting in 1980 (prior to 2000 the data is annual). The regional mall data starts in 2000. Back in the '80s, there was overbuilding in the mall sector even as the vacancy rate was rising. This was due to the very loose commercial lending that led to the S&L crisis.
In the mid-'00s, mall investment picked up as mall builders followed the "roof tops" of the residential boom (more loose lending). This led to the vacancy rate moving higher even before the recession started. Then there was a sharp increase in the vacancy rate during the recession and financial crisis.
Mall vacancy data courtesy of Reis.


