by Calculated Risk on 1/18/2016 03:35:00 PM
Monday, January 18, 2016
Lawler: Early Read on Existing Home Sales in December and Post-Mortem on November
From housing economist Tim Lawler:
Based on publicly-available local realtor/MLS reports released across the country through today, I project that existing home sales as estimated by the National Association of Realtors ran at a seasonally adjusted annual rate of 5.36 million in December, up 12.6% from November’s preliminary pace and up 5.7% from last Decembers seasonally adjusted pace. The bounce back in sales from November’s “shockingly” low pace – which occurred in many but by no means all markets across the country – strongly suggests that the new “TRID” disclosure rules and/or documents artificially depressed the pace of home sales in November – though by the same token they may have artificially inflated slightly the pace of sales in December.
As noted above, the bounce-back in sales last month was not only uneven across the country, but uneven even across different markets in the same state. Here are a few examples (the YOY increase in sales are based on preliminary reports).
| YOY % Change, Home Sales | ||
|---|---|---|
| Nov-15 | Dec-15 | |
| North Texas | 8.7% | 20.1% |
| Houston | -10.5% | -9.3% |
| Triangle Region | -1.0% | 13.1% |
| Charlotte | -3.3% | -2.6% |
| Toledo | -7.0% | 16.0% |
| Columbus | 4.0% | 6.0% |
| Tucson | 3.5% | 15.9% |
| Phoenix | 6.5% | 3.8% |
On the inventory front, I forecast that the inventory of existing home sales at the end of December as estimated by the National Association of Realtors will be 1.81 million, down 11.3% from November’s preliminary level and down 2.7% from last December. Finally I expect that the NAR’s estimate of the median existing SF home sales price for December will be up 6.7% from last December.
CR Note: Existing home sales for December will be released on Friday, and the consensus is for sales of 5.19 million SAAR.
And from Lawler: Post-Mortem on November Existing Home Sales ...
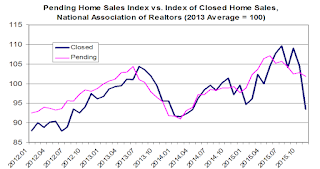
In its report on November home sales released on December 22nd, the National Association of Realtors estimated that US existing home sales ran at a seasonally adjusted annual rate of 4.76 million, down 10.5% from October’s downwardly-revised (to 5.32 million from 5.36 million) pace and down 3.8% from last November’s seasonally adjusted pace. The NAR estimated that unadjusted sales in November were unchanged from a year earlier. The NAR’s estimate was massively lower than the “consensus” forecast (5.32 million SAAR), but was also below my projection (4.97 million SAAR) from December 15th based on publicly-available realtor/MLS reports released through that date. My projection for unadjusted November sales based on regional tracking through December 15th was for a YOY gain of 2.4% (so obviously I underestimated the YOY increase in the November seasonal factor).
There have been numerous local realtor/MLS reports for November released since mid-December, and based on these reports (which comprise over 230,000 sales), I would estimate that “national” existing home sales in November on an unadjusted basis were up by just 1.3% from last November’s surprisingly slow pace, and just a bit higher than the NAR’s estimate. Any way you slice it, then, the pace of existing home sales in November was, on a seasonally adjusted basis, massively slower than in the Spring and Summer.
There is a pretty broad consensus that implementation of new mortgage disclosure rules and closing documents, which went into effect in early October, delayed some home closings in November and as such were behind some of the steep drop-off in sales, though it is difficult to quantify this impact (though any impact appears to have varied considerably across various markets). One reason for this consensus is that there was no plunge in various measures of pending home sales – though the NAR’s Pending Home Sales Index has been trending downward since May.

It is worth noting, of course, that the NAR’s Pending Home Sales Index has not been a great predictor of monthly home sales of late. These are several reasons for the “imperfect” linkage: first, of course, monthly data don’t give any indication of the intra-monthly pattern of signed contracts; second, contract “fallout” rates can vary; third, the NAR’s “sample size” for pending home sales is only half as large as that for closed sales; and finally, “data quality” issues are more significant in the pending home sales statistics than in the closed home sales statistics1.
Nevertheless, if in fact the new disclosure/closing rules and documents were behind much of the plunge in November home sales, then one would expect to see a sharp snap back in sales in December.
1This was especially apparent in the NAR’s Pending Home Sales Index in the West, which I noted in 2014 looked “just plain wrong.” Early last year the NAR made massive revisions in it Pending Home Sales Index for the West that now look more reasonable.


