by Calculated Risk on 2/06/2017 10:01:00 AM
Monday, February 06, 2017
Black Knight: "7.4 million homes lost to foreclosure sale since 2007"
Black Knight Financial Services (BKFS) released their Mortgage Monitor report for December today. According to BKFS, 4.42% of mortgages were delinquent in December, down from 4.78% in December 2015. BKFS also reported that 0.95% of mortgages were in the foreclosure process, down from 1.37% a year ago.
This gives a total of 5.37% delinquent or in foreclosure.
Press Release: Black Knight’s Mortgage Monitor: Historical Data Suggests Up to 300,000 Delinquent Borrowers May Use Tax Refunds to Pay Mortgages Current; Affordability Suffers from Rate Increases
Today, the Data & Analytics division of Black Knight Financial Services, Inc. (NYSE: BKFS) released its latest Mortgage Monitor Report, based on data as of the end of December 2016. This month, Black Knight examined Internal Revenue Service (IRS) tax filing statistics in conjunction with mortgage performance data to quantify potential impacts of the upcoming tax season on the mortgage market. As Black Knight Data & Analytics Executive Vice President Ben Graboske explained, there has historically been a distinct correlation between income tax refund disbursements and delinquent mortgages curing to current status.
“Looking at IRS filing statistics, we see that nearly one in five Americans file their returns within the first two weeks of tax season, and over 40 percent had completed their taxes by the first week in March,” said Graboske. “Unsurprisingly, incentive played a big role in this timing; not only were Americans who filed early more likely to receive a refund than those filing later, but they also received larger refunds on average. Likewise, mortgage cures -- delinquent borrowers who bring themselves back to current status -- correspondingly spike in February and March as well, suggesting that some portion of Americans are using their tax refunds to make past-due payments on their mortgages. In recent years, this has meant nearly 300,000 borrowers on average paying their loans current in February and March alone, on top of normal cure volumes for the typical month. All things being equal, there’s no reason to expect this tax season to be any different.
“We see this increase in cures across the delinquency and foreclosure spectrum, but it is most pronounced in the early and moderate stages of delinquency. ...”
emphasis added
 Click on graph for larger image.
This graph from Black Knight shows the number of foreclosure starts (and repeat foreclosures) per year.
From Black Knight:
• Nearly 790K mortgages were referred to foreclosure in 2016; 57 percent of these were repeats (mortgages that had been referred to foreclosure at least once previously)
• 335K first time foreclosure starts is the lowest oneyear total since before the turn of the century, and was actually 20 percent below what we saw in 2015
• As of Q4 2016, over 13 million foreclosures had been initiated since 2007
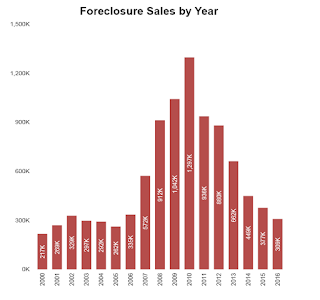
 This graph from Black Knight shows foeclosure sales per year:
From Black Knight:
• There were 309K foreclosure sales in 2016, marking a 19 percent decline from 2015 and the lowest yearly total since 2005There is much more in the mortgage monitor.
• This is still slightly elevated from historical perspective; 2000-2005 averaged ~275k foreclosure sales/year
• Overall there have now been 7.4 million homes lost to foreclosure sale since 2007


