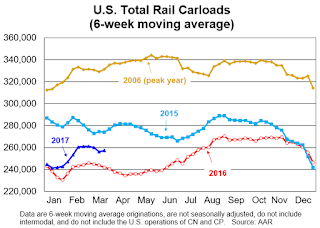
Total carloads on U.S. railroads in March 2017 were up 7.3% (87,183 carloads) over March 2016; excluding coal, carloads in March were up 2.7% (23,337 carloads). Intermodal containers and trailers were up 3.8% (47,180 units) for the month. Year-to-date total carloads through March were up 5.7% (180,665 carloads), while year-to-date intermodal volume was up 1.4% (47,977 units) over last year.
 Click on graph for larger image.
This graph from the Rail Time Indicators report shows U.S. average weekly rail carloads (NSA). Dark blue is 2017.
Rail carloads have been weak over the last decade due to the decline in coal shipments.
U.S. railroads originated 1,283,489 total carloads in March 2017, up 87,183 carloads (7.3%) over March 2016. It’s the fifth straight year-over-year carload increase (see the chart below right) and the biggest percentage carload increase in those five months. Total carloads averaged 256,698 per week in March 2017, much better than the 239,261 weekly average in March 2016 but otherwise the lowest weekly average for March since our data begin in 1988. The best March ever was 2006, when carloads averaged 337,465 per week — 31.5% higher than in March 2017. Note that Easter Sunday and the preceding week are included in March 2016 numbers, but will be included in April 2017 numbers. For the first three months of 2017, total U.S. carloads were 3,324,102, up 5.7% (180,665 carloads) over the first three months of 2016 but otherwise the lowest January-March total since sometime prior to 1988 ...
 The second graph is for intermodal traffic (using intermodal or shipping containers):
U.S. railroads originated 1,298,173 intermodal containers and trailers in March 2017, up 3.8% (47,180 units) over March 2016. Average weekly volume of 259,635 containers and trailers was the second highest for March ever (behind 2015).