From HotelNewsNow.com: STR: US hotel results for week ending 1 April
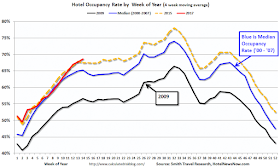
The U.S. hotel industry recorded positive results in the three key performance metrics during the week of 26 March through 1 April 2017, according to data from STR.The following graph shows the seasonal pattern for the hotel occupancy rate using the four week average.
STR analysts note that performance was lifted for the second week in a row by an Easter calendar shift (27 March 2016). In comparison with the week of 27 March through 2 April 2016, the industry reported the following in year-over-year comparisons:
• Occupancy: +2.4% to 68.5%
• Average daily rate (ADR): +2.9% to US$126.02
• Revenue per available room (RevPAR): +5.3% to US$86.27
emphasis added
 The red line is for 2017, dashed is 2015, blue is the median, and black is for 2009 - the worst year since the Great Depression for hotels.
2015 was the best year on record for hotels.
For hotels, occupancy will now move mostly sideways until the summer travel season.
Data Source: STR, Courtesy of HotelNewsNow.com