The U.S. Census Bureau announced today that real median household income increased by 3.2 percent between 2015 and 2016, while the official poverty rate decreased 0.8 percentage points. At the same time, the percentage of people without health insurance coverage decreased.One of the metrics to follow is a ratio of house prices to incomes. The following graphs use annual averages of the Case-Shiller house price index - and the nominal median household income (and the mean for the fourth fifth income) through 2016.
Median household income in the United States in 2016 was $59,039, an increase in real terms of 3.2 percent from the 2015 median income of $57,230. This is the second consecutive annual increase in median household income.
The nation’s official poverty rate in 2016 was 12.7 percent, with 40.6 million people in poverty, 2.5 million fewer than in 2015. The 0.8 percentage point decrease from 2015 to 2016 represents the second consecutive annual decline in poverty.
 Click on graph for larger image.
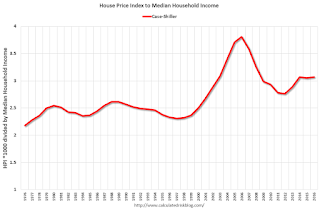
This graph shows the ratio of house price indexes divided by the Median Household Income through 2016 (the HPI is first multiplied by 1000).
This uses the annual average National Case-Shiller index since 1976.
As of 2016, house prices were above the median historical ratio - but far below the bubble peak.
The second graph is similar but uses the mean of the fourth fifth household income (if we separate households into fifths, this is the second highest income group).
 These are key households since they are more likely to be homeowners (and home buyers).
Using this group, prices are well below the bubble peak.
Going forward, I think it would be a positive if incomes outpaced house prices, or at least kept pace with house prices increases for a few years.