by Calculated Risk on 10/20/2017 12:35:00 PM
Friday, October 20, 2017
A Few Comments on September Existing Home Sales
Earlier: NAR: "Existing-Home Sales Inch 0.7 Percent Higher in September"
First, as usual, housing economist Tom Lawler's estimate was much closer to the NAR report than the consensus. So the slight month-to-month increase in reported sales, in September, was no surprise for CR readers.
My view is a sales rate of 5.39 million is solid. In fact, I'd consider any existing home sales rate in the 5 to 5.5 million range solid based on the normal historical turnover of the existing stock. As always, it is important to remember that new home sales are more important for jobs and the economy than existing home sales. Since existing sales are existing stock, the only direct contribution to GDP is the broker's commission. There is usually some additional spending with an existing home purchase - new furniture, etc. - but overall the economic impact is small compared to a new home sale.
Inventory is still very low and falling year-over-year (down 6.4% year-over-year in September). Inventory has declined year-over-year for 28 consecutive months. I started the year expecting inventory would be increasing year-over-year by the end of 2017. That now seems unlikely.
However this was the lowest year-over-year decline this year, and inventory could bottom this year. Inventory is a key metric to watch. More inventory would probably mean smaller price increases, and less inventory somewhat larger price increases.
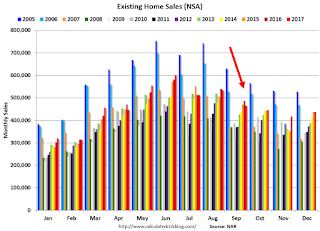
The following graph shows existing home sales Not Seasonally Adjusted (NSA).

Sales NSA in September (465,000, red column) were below sales in September 2016 (486,000, NSA) and sales in September 2015 (471,000).
Sales NSA are now slowing seasonally, and sales NSA will be lower in Q4.


