by Calculated Risk on 7/23/2018 11:59:00 AM
Monday, July 23, 2018
A Few Comments on June Existing Home Sales
Earlier: NAR: Existing-Home Sales Decline in June, Inventory UP Year-over-year
The big story in the monthly existing home report was that inventory was UP year-over-year for the first time since 2015. I've write more about this.
A few key points:
1) As usual, housing economist Tom Lawler's forecast was closer to the NAR report than the consensus. See: Lawler: Early Read on Existing Home Sales in April. The consensus was for sales of 5.45 million SAAR, Lawler estimated the NAR would report 5.35 million SAAR in June, and the NAR actually reported 5.38 million.
2) Inventory is still very low, but increased 0.5% year-over-year (YoY) in June. This was the 1st year-over-year increase since June 2015, following 36 consecutive months with a year-over-year decline in inventory.
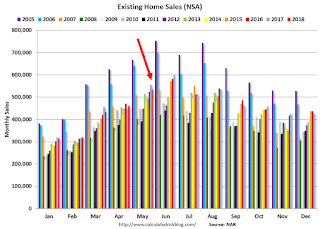
The following graph shows existing home sales Not Seasonally Adjusted (NSA).

Sales NSA in June (570,000, red column) were below sales in June 2017 (600,000, NSA).
Sales NSA through June (first six months) are down about 2.2% from the same period in 2017.
This is a small decline - but it is possible there has been an impact from higher interest rates and / or the changes to the tax law (eliminating property taxes write-off, etc).


