by Calculated Risk on 10/22/2018 10:02:00 AM
Monday, October 22, 2018
Housing Inventory Tracking
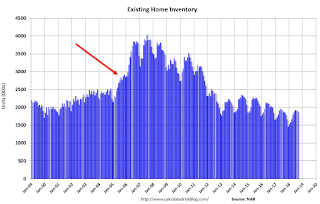
Update: Watching existing home "for sale" inventory is very helpful. As an example, the increase in inventory in late 2005 helped me call the top for housing.
And the decrease in inventory eventually helped me correctly call the bottom for house prices in early 2012, see: The Housing Bottom is Here.
And in 2015, it appeared the inventory build in several markets was ending, and that boosted price increases.
I don't have a crystal ball, but watching inventory helps understand the housing market.
Inventory, on a national basis, was up 1.1% year-over-year (YoY) in September, this the second consecutive YoY increase, following over three years of YoY declines.
The graph below shows the YoY change for non-contingent inventory in Houston, Las Vegas, Sacramento, and Phoenix (through September) and total existing home inventory as reported by the NAR (also through September). (I'll be adding more areas).

The black line is the year-over-year change in inventory as reported by the NAR.
Note that inventory was up 33% YoY in Las Vegas in September (red), the third consecutive month with a YoY increase.
Houston is a special case, and inventory was up for several years due to lower oil prices, but declined YoY recently as oil prices increased. Inventory was up 6% year-over-year in Houston in September.
Inventory is a key for the housing market, and I am watching inventory for the impact of the new tax law and higher mortgage rates on housing. I expect national inventory will be up YoY at the end of 2018 (but still to be somewhat low).
Also note that inventory in Seattle was up 78% year-over-year in September (not graphed)!

Although I expect inventory to increase YoY in 2018, I expect inventory to follow the normal seasonal pattern (not keep increasing all year like in 2005).
So the current increase in inventory is not comparable to late 2005 when inventory increased sharply signaling the end of the housing bubble.
Also inventory is still very low. In cities like Las Vegas and Sacramento, inventory has finally moved above 2 months supply - but still historically low.


