by Calculated Risk on 11/22/2018 08:31:00 AM
Thursday, November 22, 2018
Five Economic Reasons to be Thankful
With a Hat Tip to Neil Irwin (he started doing this several years ago) ... here are five economic reasons to be thankful this Thanksgiving ...
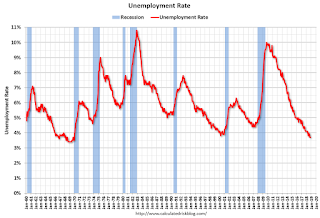
1) Low unemployment rate.
The unemployment rate declined to 3.7% in October. The unemployment rate is down from 4.1% in October 2017 (a year ago), and is down from the cycle peak of 10.0% in October 2009.

This is the lowest level for the unemployment rate since 1969!
Also, this is the largest decline in the unemployment rate, from cycle peak-to-trough, since the BLS started tracking the unemployment rate in 1948. (In the early '80s, the unemployment rate declined from 10.8% to 5.0%; a decline of 5.8 percentage points. The current decline from 10.0% to 3.7% is 6.3 percentage points!)
2) Low unemployment claims.

Here is a graph of initial weekly unemployment claims.
The dashed line on the graph is the current 4-week average. The four-week average of weekly unemployment claims is at 218,500.
The low level of claims suggests relatively few layoffs.
3) Job Openings Near Series High.
There were 7.0 million job openings in September. This is close to the series high of 7.29 million in August 2018.

For the sixth consecutive month, there were more job openings than people unemployed. Also note that the number of job openings has exceeded the number of hires since January 2015 (almost 4 years).
Also Quits are up 11% year-over-year. These are voluntary separations. (see light blue columns at bottom of graph for trend for "quits").
More job openings, and rising quits, are positive signs for the labor market.
4) Wages have been increasing at a faster rate.

The graph shows the nominal year-over-year change in "Average Hourly Earnings" for all private employees. Nominal wage growth was at 3.1% YoY in October.
Wage growth has generally been trending up for several years.
5) Household Debt burdens are near record lows.
Household debt burdens have declined sharply since the great recession.
The Household debt service ratio was at 13.2% in 2007, and has fallen to a series low of 9.84% in Q2 2018 (most recent data).

The overall Debt Service Ratio decreased in Q2 2018, and has been moving sideways and is at a series low. Note: The financial obligation ratio (FOR) was declined in Q2 and is also near a series low (not shown).
The DSR for mortgages (blue) is also at a series low (since at least 1980). This ratio increased rapidly during the housing bubble, and continued to increase until 2007.
This data suggests aggregate household cash flow has improved.
Happy Thanksgiving to All!


