Industrial production decreased 0.6 percent in January after rising 0.1 percent in December. In January, manufacturing production fell 0.9 percent, primarily as a result of a large drop in motor vehicle assemblies; factory output excluding motor vehicles and parts decreased 0.2 percent. The indexes for mining and utilities moved up 0.1 percent and 0.4 percent, respectively. At 109.4 percent of its 2012 average, total industrial production was 3.8 percent higher in January than it was a year earlier. Capacity utilization for the industrial sector decreased 0.6 percentage point in January to 78.2 percent, a rate that is 1.6 percentage points below its long-run (1972–2018) average.
emphasis added
 Click on graph for larger image.
This graph shows Capacity Utilization. This series is up 11.5 percentage points from the record low set in June 2009 (the series starts in 1967).
Capacity utilization at 78.2% is 1.6% below the average from 1972 to 2017 and below the pre-recession level of 80.8% in December 2007.
Note: y-axis doesn't start at zero to better show the change.
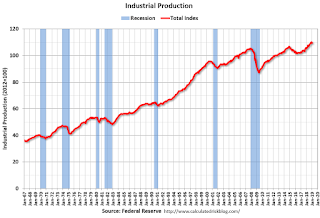
 The second graph shows industrial production since 1967.
Industrial production decreased in January to 109.4. This is 25.6% above the recession low, and 3.8% above the pre-recession peak.
The decrease in industrial production and capacity utilization were well below consensus.