by Calculated Risk on 3/26/2019 09:12:00 AM
Tuesday, March 26, 2019
Case-Shiller: National House Price Index increased 4.3% year-over-year in January
S&P/Case-Shiller released the monthly Home Price Indices for January ("January" is a 3 month average of November, December and January prices).
This release includes prices for 20 individual cities, two composite indices (for 10 cities and 20 cities) and the monthly National index.
Note: Case-Shiller reports Not Seasonally Adjusted (NSA), I use the SA data for the graphs.
From S&P: S&P CoreLogic Case-Shiller Index Shows Annual Gains Lowest Since 2015
The S&P CoreLogic Case-Shiller U.S. National Home Price NSA Index, covering all nine U.S. census divisions, reported a 4.3% annual gain in January, down from 4.6% in the previous month. The 10-City Composite annual increase came in at 3.2%, down from 3.7% in the previous month. The 20-City Composite posted a 3.6% year-over-year gain, down from 4.1% in the previous month.
Las Vegas, Phoenix and Minneapolis reported the highest year-over-year gains among the 20 cities. In January, Las Vegas led the way with a 10.5% year-over-year price increase, followed by Phoenix with a 7.5% increase and Minneapolis with a 5.1% increase. Only one of the 20 cities reported greater price increases in the year ending January 2019 versus the year ending December 2018.
...
Before seasonal adjustment, the National Index posted a month-over-month decrease of 0.2% in January. The 10-City and 20-City Composites reported 0.3% and 0.2% decreases for the month, respectively. After seasonal adjustment, the National Index recorded a 0.2% month-over-month increase in January. The 10-City Composite did not post any gains, and the 20-City Composite posted 0.1% month-over-month increase. In January, five of 20 cities reported increases before seasonal adjustment, while 14 of 20 cities reported increases after seasonal adjustment.
“Home price gains continue to shrink,” says David M. Blitzer, Managing Director and Chairman of the Index Committee at S&P Dow Jones Indices. “In the year to January, the S&P CoreLogic Case-Shiller National Index rose 4.3%, two percentage points slower than its pace in January 2018. The last time it advanced this slowly was April 2015. In 16 of the 20 cities tracked, price gains were smaller in January 2019 than in January 2018. Only Phoenix saw any appreciable acceleration. Some cities where prices surged in 2017-2018 now face much smaller increases: in Seattle, annual price gains dropped from 12.8% to 4.1% from January 2018 to January 2019. San Francisco saw annual price increases shrink from 10.2% to 1.8% over the same time period.
Mortgage rates are as important as prices for many home buyers. Mortgage rates climbed from 3.95% in January 2018 to a peak of 4.95% in November 2018. Since then, rates have dropped to 4.28% as of mid-March. Sales of existing single-family homes slid gently downward from the 2017 fourth quarter until January of this year before jumping higher in February 2019. Home sales annual rate dropped from 5 million units in February 2018 to 4.36 million units in January 2019 before popping to 4.94 in February. It remains to be seen if recent low mortgage rates and smaller price gains can sustain improved home sales.”
emphasis added
 Click on graph for larger image.
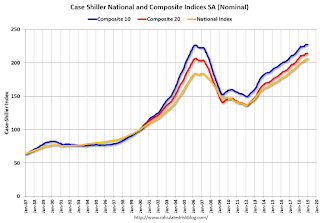
 The first graph shows the nominal seasonally adjusted Composite 10, Composite 20 and National indices (the Composite 20 was started in January 2000).
The Composite 10 index is up slightly from the bubble peak, and up slightly in January (SA).
The Composite 20 index is 3.8% above the bubble peak, and up 0.1% (SA) in January.
The National index is 12.0% above the bubble peak (SA), and up 0.2% (SA) in January. The National index is up 51.5% from the post-bubble low set in December 2011 (SA).
 The second graph shows the Year over year change in all three indices.
The Composite 10 SA is up 3.2% compared to January 2018. The Composite 20 SA is up 3.6% year-over-year.
The National index SA is up 4.3% year-over-year.
Note: According to the data, prices increased in 15 of 20 cities month-over-month seasonally adjusted.
I'll have more later.


