by Calculated Risk on 3/23/2019 08:11:00 AM
Saturday, March 23, 2019
Schedule for Week of March 24, 2019
The key reports this week are the third estimate of Q4 GDP, February Housing Starts and New Home Sales.
Other key reports include Case-Shiller house prices, and Personal Income for February, and Personal Outlays for January.
For manufacturing, the March Dallas, Richmond and Kansas City manufacturing surveys will be released.
8:30 AM ET: Chicago Fed National Activity Index for February. This is a composite index of other data.
10:30 AM: Dallas Fed Survey of Manufacturing Activity for March.
 8:30 AM ET: Housing Starts for February.
 This graph shows single and total housing starts since 1968.
The consensus is for 1.201 million SAAR, down from 1.230 million SAAR in January.
9:00 AM: FHFA House Price Index for January 2019. This was originally a GSE only repeat sales, however there is also an expanded index.
 9:00 AM: S&P/Case-Shiller House Price Index for January.
This graph shows the nominal seasonally adjusted National Index, Composite 10 and Composite 20 indexes through the most recent report (the Composite 20 was started in January 2000).
The consensus is for a 4.2% year-over-year increase in the Comp 20 index for December.
10:00 AM: Richmond Fed Survey of Manufacturing Activity for March.
7:00 AM ET: The Mortgage Bankers Association (MBA) will release the results for the mortgage purchase applications index.
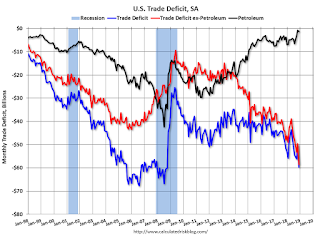
 8:30 AM: Trade Balance report for January from the Census Bureau.
 This graph shows the U.S. trade deficit, with and without petroleum, through the most recent report. The blue line is the total deficit, and the black line is the petroleum deficit, and the red line is the trade deficit ex-petroleum products.
The consensus is the trade deficit to be $57.4 billion. The U.S. trade deficit was at $59.8 billion in December.
8:30 AM: The initial weekly unemployment claims report will be released. The consensus is for 225 thousand initial claims, up from 221 thousand the previous week.
8:30 AM: Gross Domestic Product, 4th quarter 2018 (Third estimate). The consensus is that real GDP increased 2.2% annualized in Q4, down from the initial estimate of 2.6%.
10:00 AM: Pending Home Sales Index for February. The consensus is for a 1.0% decrease in the index.
11:00 AM: the Kansas City Fed manufacturing survey for March. This is the last of regional manufacturing surveys for March.
8:30 AM ET: Personal Income, February 2019; Personal Outlays, January 2019. The consensus is for a 0.3% increase in personal income, and for a 0.3% increase in personal spending. And for the Core PCE price index to increase 0.2%.
9:45 AM: Chicago Purchasing Managers Index for March. The consensus is for a reading of 60.3, down from 64.7 in February.
 10:00 AM: New Home Sales for February from the Census Bureau.
 This graph shows New Home Sales since 1963. The dashed line is the sales rate for last month.
The consensus is for 616 thousand SAAR, up from 607 thousand in January.
10:00 AM: University of Michigan's Consumer sentiment index (Final for March). The consensus is for a reading of 97.8.


