Also, the Q1 quarterly Reis surveys for office and malls will be released this week.
 8:30 AM: Retail sales for February is scheduled to be released. The consensus is for a 0.3% increase in retail sales.
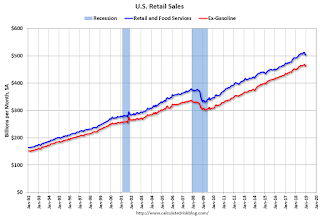
This graph shows the year-over-year change in retail sales and food service (ex-gasoline) since 1993. Retail and Food service sales, ex-gasoline, increased by 2.9% on a YoY basis in December.
Early: Reis Q1 2019 Office Survey of rents and vacancy rates.
 10:00 AM: ISM Manufacturing Index for March. The consensus is for the ISM to be at 54.0, down from 54.2 in February.
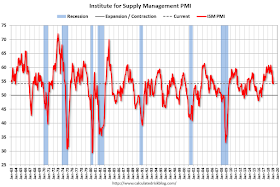
Here is a long term graph of the ISM manufacturing index.
The PMI was at 54.2% in February, the employment index was at 53.2%, and the new orders index was at 55.5%
10:00 AM: Construction Spending for February. The consensus is for a 0.1% decrease in construction spending.
 All day: Light vehicle sales for March. The consensus is for light vehicle sales to be 16.8 million SAAR in March, up from 16.5 million in February (Seasonally Adjusted Annual Rate).
This graph shows light vehicle sales since the BEA started keeping data in 1967. The dashed line is the February sales rate.
Early: Reis Q1 2019 Mall Survey of rents and vacancy rates.
8:30 AM: Durable Goods Orders for February from the Census Bureau. The consensus is for a 1.9% decrease in durable goods orders.
10:00 AM: Corelogic House Price index for February.
7:00 AM ET: The Mortgage Bankers Association (MBA) will release the results for the mortgage purchase applications index.
8:15 AM: The ADP Employment Report for March. This report is for private payrolls only (no government). The consensus is for 160,000 payroll jobs added in March, down from 183,000 added in February.
10:00 AM: the ISM non-Manufacturing Index for March. The consensus is for a reading of 58.0, down from 59.7.
8:30 AM: The initial weekly unemployment claims report will be released. The consensus is for 216 thousand initial claims, up from 211 thousand the previous week.
 8:30 AM: Employment Report for March. The consensus is for 169,000 jobs added, and for the unemployment rate to be unchanged at 3.8%.
There were 20,000 jobs added in February, and the unemployment rate was at 3.8%.
This graph shows the year-over-year change in total non-farm employment since 1968.
In February the year-over-year change was 2.509 million jobs.
3:00 PM: Consumer Credit from the Federal Reserve.