by Calculated Risk on 6/03/2019 08:46:00 AM
Monday, June 03, 2019
Black Knight Mortgage Monitor for March: Record Low National Delinquency Rate
Black Knight released their Mortgage Monitor report for April today. According to Black Knight, 3.47% of mortgages were delinquent in April, down from 3.67% in April 2018. Black Knight also reported that 0.50% of mortgages were in the foreclosure process, down from 0.61% a year ago.
This gives a total of 3.97% delinquent or in foreclosure.
Press Release: Black Knight Reports Home Price Growth Continues to Slow, Falling Below 25-Year Average for First Time Since 2012; Affordability at Strongest Point in More Than a Year
Today, the Data & Analytics division of Black Knight, Inc. released its latest Mortgage Monitor Report, based upon the company’s industry-leading mortgage performance, housing and public records datasets. This month, leveraging its McDash loan-level mortgage performance data in combination with the Black Knight Home Price Index (HPI), the company revisited the home price and affordability landscape. As Black Knight’s Data & Analytics Division President Ben Graboske explained, home prices continued their trend of deceleration in March, but lower interest rates over the past three months have brought affordability to its best point in more than a year.
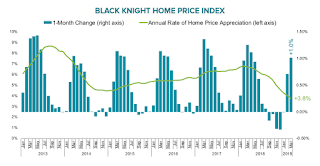
“In what is usually the calendar-year high point for home price gains, month-over-month appreciation in March 2019 was just 1%, down from 1.25% at the same time last year,” said Graboske. “Likewise, the annual rate of appreciation has now slipped to 3.8%, the first time annual home price growth has fallen below its 25-year average of 3.9% since 2012. That makes 13 consecutive months of home price deceleration. As we’ve been reporting, home prices began to decelerate in February 2018 as rising interest rates started putting pressure on affordability. The situation intensified in the last half of the year as 30-year fixed rates peaked near 5% in November, bringing affordability levels close to their long-term averages. Of course, rates have since declined, and are now hovering close to 4%. However, they didn’t fall below 4.25% until the last week of March, meaning we likely won’t see the impact – if any – on home prices until May or June housing numbers.
“Regardless, falling rates have already had a positive impact on affordability. In fact, the monthly payment needed to purchase the average-priced home with a 20% down payment has declined by 6% in the last six months. It currently requires $1,173 per month to make that purchase, the lowest such payment in more than a year. When we factor income into the equation, we see that it takes 22% of the median income to purchase the average-priced home. That’s the lowest payment-to-income ratio in more than a year as well, and far below the long-term average of 25.1%. That the market reacted in terms of slowing home price growth even before we hit that long-term average suggests that a 25% payment-to-income ratio may not be sustainable in today’s market, whether due to excess non-mortgage related debt, lending standards or other factors.”
emphasis added
 Click on graph for larger image.
Here is a graph from the Mortgage Monitor that shows the National delinquency rate over time.
From Black Knight:
• After seeing delinquencies decline by less than 6% over the first three months of 2019 – the lowest seasonal improvement to start any year on record – April made up for lost groundThe second graph shows the one month change in house prices as calculated by Black Knight, and the year-over-year change:
• April marked a record-low for the national delinquency rate
• The national delinquency rate declined by 5% in April alone, bringing the aggregate 2019 YTD improvement to -10.6%

• In March – a month that typically sees the largest home price gains of the year – prices rose by just 1%, marking 13 consecutive months of home price decelerationThere is much more in the mortgage monitor.
• The annual rate of appreciation has now slipped to 3.8%, the first time annual home price growth has fallen below its 25-year average of 3.9% since 2012
• Home prices began to decelerate in February 2018 as rising interest rates put pressure on affordability, intensifying toward the end of the year as 30-year fixed rates peaked near 5% in November
• Rates have since declined, and are now hovering close to 4%; however, they didn’t fall below 4.25% until the last week of March, meaning we likely won’t see the impact – if any – on home prices until May or June housing numbers are available


