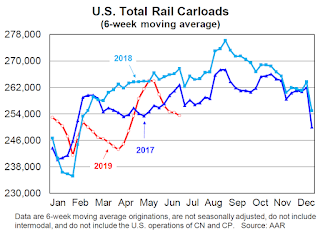
Total U.S. rail carloads in June 2019 were down 5.3% (57,173 carloads) from June 2018, as just 4 of the 20 carload commodities the AAR tracks had carload gains. ... Last year was the best year ever for intermodal, but this year isn’t keeping up. In June 2019, U.S. intermodal originations were down 7.2% from June 2018, their fifth straight decline and the biggest percentage decline since April 2016.
emphasis added
 Click on graph for larger image.
This graph from the Rail Time Indicators report shows U.S. average weekly rail carloads (NSA). Red is 2019.
Rail carloads have been weak over the last decade due to the decline in coal shipments.
Total U.S. rail carloads were 1.02 million in June 2019, down 5.3%, or 57,173 carloads, from June 2018. It was the fifth straight monthly decline.
...
In 2019 through June, total U.S. carloads were 6.55 million, down 2.9%, or 195,168 carloads, from the first six months of 2018. Since 1988, when our data begin, only 2016 had fewer total carloads in the first half of the year.
 The second graph is for intermodal traffic (using intermodal or shipping containers):
U.S. intermodal originations totaled 1.08 million containers and trailers in June 2019, down 7.2%, or 84,002 units, from June 2018. The 7.2% decline was the fifth straight monthly decline and the biggest percentage decline since April 2016. … U.S. intermodal volume in the first half of 2019 was higher than every other year other than 2018 (see the middle right chart below), so it’s not like this year is a catastrophe.