by Calculated Risk on 7/27/2019 08:11:00 AM
Saturday, July 27, 2019
Schedule for Week of July 28, 2019
The key report this week is the July employment report.
Other key reports include Personal Income and Outlays for June, Case-Shiller house prices for May, and the Trade deficit for June.
For manufacturing, the July Dallas Fed, and the July ISM manufacturing surveys will be released.
The FOMC meets this week, and the Fed is expected to announce a 25bps cut to the Fed Funds rate.
10:30 AM: Dallas Fed Survey of Manufacturing Activity for July. This is the last of the regional surveys for July.
8:30 AM ET: Personal Income and Outlays, June 2019. The consensus is for a 0.3% increase in personal income, and for a 0.3% increase in personal spending. And for the Core PCE price index to increase 0.2%.
 9:00 AM: S&P/Case-Shiller House Price Index for May.
This graph shows the year-over-year change in the seasonally adjusted National Index, Composite 10 and Composite 20 indexes through the most recent report (the Composite 20 was started in January 2000).
The consensus is for a 2.6% year-over-year increase in the Comp 20 index for May.
10:00 AM: Pending Home Sales Index for June. The consensus is for a 0.3% increase in the index.
7:00 AM ET: The Mortgage Bankers Association (MBA) will release the results for the mortgage purchase applications index.
8:15 AM: The ADP Employment Report for July. This report is for private payrolls only (no government). The consensus is for 155,000 payroll jobs added in July, up from 102,000 added in June.
9:45 AM: Chicago Purchasing Managers Index for July.
2:00 PM: FOMC Meeting Announcement. The Fed is expected to announce a 25bps cut to the Fed Funds rate at this meeting.
2:30 PM: Fed Chair Jerome Powell holds a press briefing following the FOMC announcement.
8:30 AM: The initial weekly unemployment claims report will be released. The consensus is for 213 thousand initial claims, up from 206 thousand last week.
 10:00 AM: ISM Manufacturing Index for July. The consensus is for the ISM to be at 51.9, up from 51.7 in June.
Here is a long term graph of the ISM manufacturing index.
The employment index was at 54.5 in June, and the new orders index was at 50.0%.
10:00 AM: Construction Spending for June. The consensus is for a 0.4% increase in construction spending.
 8:30 AM: Employment Report for July. The consensus is for 156,000 jobs added, and for the unemployment rate to decline to 3.6%.
There were 224,000 jobs added in June, and the unemployment rate was at 3.7%.
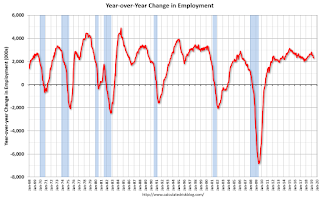
This graph shows the year-over-year change in total non-farm employment since 1968.
In June, the year-over-year change was 2.301 million jobs.
 8:30 AM: Trade Balance report for June from the Census Bureau.
 This graph shows the U.S. trade deficit, with and without petroleum, through the most recent report. The blue line is the total deficit, and the black line is the petroleum deficit, and the red line is the trade deficit ex-petroleum products.
The consensus is the trade deficit to be $54.7 billion. The U.S. trade deficit was at $55.5 Billion the previous month.
10:00 AM: University of Michigan's Consumer sentiment index (Final for July). The consensus is for a reading of 98.4.


