by Calculated Risk on 8/28/2019 04:23:00 PM
Wednesday, August 28, 2019
Black Knight on "Tappable Equity"
Here are some comments and two graphs from Black Knight on tappable equity.
Tappable equity grew by >$335B in Q2 2019
• Tappable equity growth had been slowing in recent quarters due to rising interest rates and slowing home price growth
 Click on graph for larger image.
This graph from Black Knight shows the Black Knight's estimate of "tappable equity".
• However, its Q2 growth rate was slightly above Q1’s (+4.2% vs. 3%)
• A total of $6.3T in tappable equity is now held by 45M U.S. mortgage holders
• That’s the highest volume ever recorded, and 26% above the mid-2006 peak of $5T
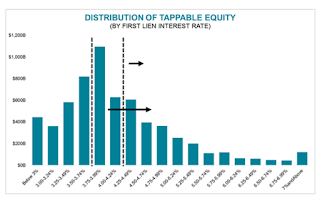
 This graph from Black Knight shows the distribution of "tappable equity" by first lien mortgage rate.
• Nearly half (49%) of the 45M homeowners with tappable equity have 1st lien interest rates ≥4.25%, making refi an attractive option (most also fall into the population of refinance candidates we’ve been tracking)CR Note: A pickup in cash out refinancing could give a small boost to the economy.
• 76% have rates at or above 3.75% – these folks could potentially tap into home equity with little change to their existing 30-year rate, or perhaps even a slight improvement


