by Calculated Risk on 1/21/2020 09:08:00 AM
Tuesday, January 21, 2020
Retired Workers and the Overall Labor Force Participation Rate
In December I wrote Ten Economic Questions for 2020. I noted that I expect the overall participation rate to start declining again in 2020, pushing down the unemployment rate.
Note: Every month, with the employment report, I focus on the prime participation rate because of changing demographics - but this post is about the overall participation rate.
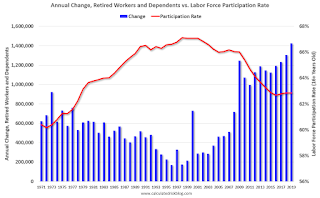
Here is a graph of the annual change in Retired workers and dependent receiving Old-Age Social Security benefits and the annual Labor Force Participation Rate since 1970. This doesn't mean these people are actually retiring (they may still be working), but this gives us an idea of how many people are retiring per year.

The number of people retiring per year was declining until the late '90s, and then started increasing.
The annual overall (16+ years old) participation rate peaked around 2000, and has generally been decreasing as more people retire.
Note: There are other factors involved in the decline in the overall participation rate - such as more people staying in school - but retiring workers is a key.
A few years ago, I predicted the overall participation rate would move mostly sideways or increase slightly as solid employment growth offset the large number of retirements. Now, given demographics, I expect to see a downward trend for the overall participation rate over the next decade, even with a healthy job market.


