by Calculated Risk on 2/21/2020 12:05:00 PM
Friday, February 21, 2020
Comments on January Existing Home Sales
Earlier: NAR: Existing-Home Sales Decreased to 5.46 million in January
A few key points:
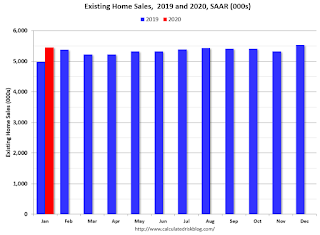
1) Existing home sales were up 9.6% year-over-year (YoY) in January.
2) Inventory is very low, and was down 10.7% year-over-year (YoY) in January. Inventory always decreases sharply in December as people take their homes off the market for the holidays, and then inventory starts to increase in February and March.

3) Sales slumped at the end of 2018 and in January 2019 due to higher mortgage rates, the stock market selloff, and fears of an economic slowdown.
The comparison to January of last year will be the easiest for this year.
Note that existing home sales picked up somewhat in the second half of 2019 as interest rates declined.

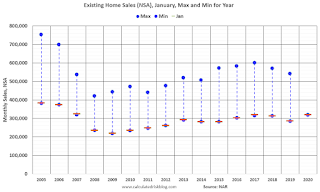
Sales NSA in January (318,000) were the highest for January since 2017.
Note that January sales (NSA) are always near the minimum for the year. The maximum is usually in June or July.
Overall this was a solid report. The very low level of inventory will be something to watch in 2020.


