by Calculated Risk on 5/11/2020 11:05:00 AM
Monday, May 11, 2020
Last Week: NY Fed Q1 Report: "Pre-COVID-19 Data Shows Total Household Debt Increased in Q1 2020"
Note: This was released last week.
From the NY Fed: Pre-COVID-19 Data Shows Total Household Debt Increased in Q1 2020, Though Growth in Non-Housing Debt Slows
The Federal Reserve Bank of New York's Center for Microeconomic Data today issued its Quarterly Report on Household Debt and Credit, which shows that total household debt increased by $155 billion (1.1%) to $14.30 trillion in the first quarter of 2020. The total balance is now $1.6 trillion higher, in nominal terms, than the previous peak of $12.68 trillion in the third quarter of 2008. The Report is based on data from the New York Fed's Consumer Credit Panel, a nationally representative sample of individual- and household-level debt and credit records drawn from anonymized Equifax credit data.
The latest report captures consumer credit data as of March 31, 2020. However, given that individual credit accounts are typically updated monthly, the data do not fully reflect the potential effects of COVID-19 that materialized in the second half of March 2020.
…
"It is critical to note that the latest report reflects a time when many of the economic effects of the COVID-19 pandemic were only starting to be felt," said Andrew Haughwout, senior vice president at the New York Fed. "We do see a larger-than-expected decline in credit card balances based on past seasonal patterns, but it is too soon to confidently assess its connection to the pandemic. We will continue to monitor these developments and the broader state of household balance sheets closely as key data are updated and the economic situation evolves."
emphasis added
 Click on graph for larger image.
Here are two graphs from the report:
The first graph shows aggregate consumer debt increased in Q1. Household debt previously peaked in 2008, and bottomed in Q2 2013.
From the NY Fed:
Aggregate household debt balances increased by $155 billion in the first quarter of 2020, a 1.1% increase, and now stand at $14.30 trillion. Balances are $1.6 trillion higher, in nominal terms, than the previous peak (2008Q3) peak of $12.68 trillion and 28.2% above the 2013Q2 trough.
Mortgage balances shown on consumer credit reports on March 31 stood at $9.71 trillion, a $156 billion increase from 2019Q4.
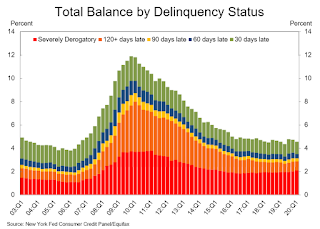
 The second graph shows the percent of debt in delinquency.
The overall delinquency rate decreased slightly in Q1. From the NY Fed:
Aggregate delinquency rates were mostly unchanged in the first quarter of 2020. As of March 31, 4.6% of outstanding debt was in some stage of delinquency, a 0.1 percentage point decrease from the fourth quarter of 2019. Of the $652 billion of debt that is delinquent, $449 billion is seriously delinquent (at least 90 days late or “severely derogatory”, which includes some debts that have been removed from lenders books but upon which they continue to attempt collection).There is much more in the report. This is mostly prior to the impact of COVID-19.
About 189,000 consumers had a bankruptcy notation added to their credit reports in 2020Q1, a small decrease from the 192,000 seen in 2019Q1.


