by Calculated Risk on 9/24/2020 10:28:00 AM
Thursday, September 24, 2020
A few Comments on August New Home Sales
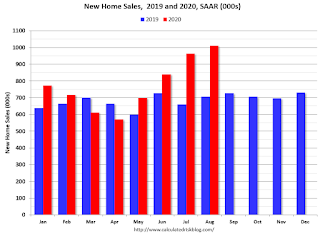
New home sales for August were reported at 1,011,000 on a seasonally adjusted annual rate basis (SAAR). Sales for the previous three months were revised up significantly.
This was well above consensus expectations, and this was the highest sales rate since 2006. Clearly low mortgages rates, low existing home supply, and low sales in March and April (due to the pandemic) have led to a strong increase in sales. Favorable demographics (something I wrote about many times over the last decade) and a surging stock market have probably helped new home sales too.
Earlier: New Home Sales increased to 1,011,000 Annual Rate in August.

This graph shows new home sales for 2019 and 2020 by month (Seasonally Adjusted Annual Rate).
New home sales were up 43.2% year-over-year (YoY) in August. Year-to-date (YTD) sales are up 14.9%.
And on inventory: since new home sales are reported when the contract is signed - even if the home hasn't been started - new home sales are not limited by inventory. Inventory for new home sales is important in that it means there will be more housing starts if inventory is low (like right now) - and fewer starts if inventory is too high (not now).
Important: No one should get too excited about new home sales as a leading indicator for the economy. Many years ago, I wrote several articles about how new home sales and housing starts (especially single family starts) were some of the best leading indicators, however, I've also noted that there are times when this isn't true. NOW is one of those times.
Currently the course of the economy will be determined by the course of the virus, and New Home Sales tell us nothing about the future of the pandemic. Without the pandemic, I'd obviously be very positive about this report.


