by Calculated Risk on 9/14/2020 11:59:00 AM
Monday, September 14, 2020
Recession Measures and NBER
Calling the beginning or end of a recession usually takes time. However, the economic decline in March was so severe that the National Bureau of Economic Research (NBER) has already called the end of the expansion in February.
The committee has determined that a peak in monthly economic activity occurred in the U.S. economy in February 2020. The peak marks the end of the expansion that began in June 2009 and the beginning of a recession. The expansion lasted 128 months, the longest in the history of U.S. business cycles dating back to 1854. The previous record was held by the business expansion that lasted for 120 months from March 1991 to March 2001.The NBER will probably wait some time before calling the end of the recession, this process can take from 18 months to two years or longer.
...
The usual definition of a recession involves a decline in economic activity that lasts more than a few months. However, in deciding whether to identify a recession, the committee weighs the depth of the contraction, its duration, and whether economic activity declined broadly across the economy (the diffusion of the downturn). The committee recognizes that the pandemic and the public health response have resulted in a downturn with different characteristics and dynamics than prior recessions. Nonetheless, it concluded that the unprecedented magnitude of the decline in employment and production, and its broad reach across the entire economy, warrants the designation of this episode as a recession, even if it turns out to be briefer than earlier contractions.
In the mean time, if the economy slides into recession again, the committee will only consider it a new recession if most major indicators were close to or above their previous highs. Otherwise it will just be considered a continuation of the previous recession.
A good example of the NBER calling two separate recessions was in the early '80s, from the NBER memo:
"The period following July 1980 will appear in the NBER chronology as an expansion. An important factor influencing that decision is that most major indicators, including real GNP, are already close to or above their previous highs."It will take some time for most major indicators to be above their previous high after the current recession because of the severe contraction as the graphs below show.
emphasis added
GDP is the key measure, as the NBER committee notes in their business cycle dating procedure:
The committee views real GDP as the single best measure of aggregate economic activity.
 Click on graph for larger image.
This graph is for real GDP through Q2 2020.
This is the key measure, and the NBER will probably use GDP and GDI to determine the trough of the recession (April and in Q2).
As of Q2, real GDP was 10.2% below the pre-recession peak.
Most forecasters expect GDP to rebound strongly in Q3, but even with a 30% annualized increase (about 6.8% QoQ), real GDP will be down about 4.2% from Q4 2019; a larger decline in real GDP than at the depth of the Great Recession.
It will take some time for real GDP to be above Q4 2019 levels.
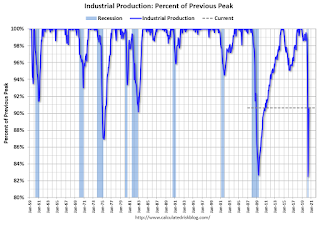
 The second graph is for monthly industrial production based on data from the Federal Reserve through July 2020.
Industrial production is off over 9.4% from the pre-recession peak, and will probably increase further in August (to be released this week).
Note that industrial production was weak prior to the onset of the pandemic.
Industrial production usually takes a long time to recover after a significant decline.
 The third graph is for employment through August 2020.
Historically employment was a coincident indicator for the end of recessions, but that hasn't been true for the previous three recessions (1990-1991, 2001, 2007-2009).
Employment is currently off about 7.6% from the pre-recession peak (dashed line). This is an improvement from off 14.5% in April, but this was from returning temporary layoffs and not from an actual recovery.
It is likely that employment will not recover to pre-recession levels for some time.
 And the last graph is for real personal income excluding transfer payments through July 2020.
Real personal income less transfer payments was still off 5% in July.
Once again it will take a long time to return to pre-recession levels.
These graphs are useful in trying to identify peaks and troughs in economic activity.
Economic activity bottomed in Q2 (in April), but the pace of the actual recovery will depend on the course of the virus.


