Travel on all roads and streets changed by -12.3% (-35.3 billion vehicle miles) for August 2020 as compared with August 2019. Travel for the month is estimated to be 251.3 billion vehicle miles.
The seasonally adjusted vehicle miles traveled for August 2020 is 239.7 billion miles, a -11.8% (-32.2 billion vehicle miles) decline from August 2019. It also represents a 0.8% increase (2 billion vehicle miles) compared with July 2020.
Cumulative Travel for 2020 changed by -15.3% (-332.5 billion vehicle miles). The cumulative estimate for the year is 1,844.4 billion vehicle miles of travel.
emphasis added
 Click on graph for larger image.
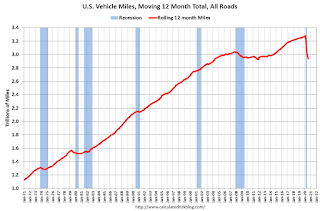
This graph shows the rolling 12 month total vehicle miles driven to remove the seasonal factors.
Miles driven declined during the great recession, and the rolling 12 months stayed below the previous peak for a record 85 months.
Miles driven declined sharply in March, and really collapsed in April.
 This graph shows the YoY change in vehicle miles driven.
Miles driven rebounded in May through August, but is still down 12.3% YoY (seasonally adjusted).
Based on gasoline consumption, I expect the year-over-year decline in vehicle miles to be about the same in September as in August.