by Calculated Risk on 10/01/2020 11:42:00 AM
Thursday, October 01, 2020
Hotels: Occupancy Rate Declined 31.5% Year-over-year
From HotelNewsNow.com: STR: U.S. hotel results for week ending 26 September
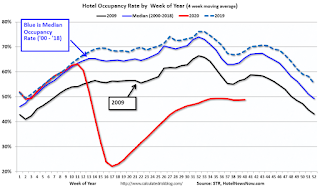
U.S. hotel occupancy remained nearly flat from the previous week, according to the latest data from STR through 26 September.The following graph shows the seasonal pattern for the hotel occupancy rate using the four week average.
20-26 September 2020 (percentage change from comparable week in 2019):
• Occupancy: 48.7% (-31.5%)
• Average daily rate (ADR): US$96.38 (-29.6%)
• Revenue per available room (RevPAR): US$46.96 (-51.7%)
...
Most of the markets with the highest occupancy levels were those in areas with displaced residents from natural disasters. Affected by Hurricane Sally, Mobile, Alabama, reported the week’s highest occupancy level at 74.9%. Amid continued wildfires, California South/Central was next at 74.3%.
emphasis added
 Click on graph for larger image.
The red line is for 2020, dash light blue is 2019, blue is the median, and black is for 2009 (the worst year since the Great Depression for hotels - before 2020).
There was some recent boost from natural disasters - perhaps 1 or 2 percentage points total based on previous disasters - but so far there has been little business travel pickup that usually happens in the Fall.
Note: Y-axis doesn't start at zero to better show the seasonal change.


