The Apartment Vacancy Rate rose to 5.0% in the third quarter, the highest rate since the first quarter of 2012.
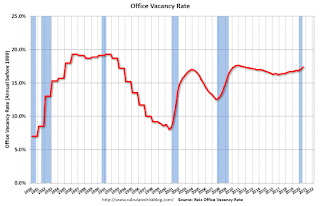
The Office Vacancy Rate rose 0.3% to 17.4%, the highest since Q3 2011 as occupancy declined by 5.85 million square feet; the Average Office Asking Rent increased 0.2%, but the Effective Rent declined 0.2% in the quarter.
The Retail Vacancy Rate increased 0.2% in the quarter to 10.4%, the highest since Q4 2013 as occupancy declined 2.63 million square feet; the Average Asking Rent declined 0.1% while the Average Effective Rent fell 0.4%.
The average Mall Vacancy Rate climbed 0.3% in the quarter to 10.1%, the highest in more than 20 years. The average Asking Rent decreased 0.7% in the quarter and 0.6% over the year.
…
Conclusion
The third quarter statistics clearly show that property owners started to feel the impact of the pandemic. Ironically, occupancy growth in the apartment market was net positive, yet rents fell dramatically, especially in some high-priced markets as tenants had the upper hand and property owners recognized this and lowered rents to maintain occupancy.
...
Finally, the office market may have seen the smallest impact thus far, but this was likely due to the term structure of leases – the average lease term is 9 years. Still, the continued work-from-home option driven by the pandemic has prompted many office planners to re-consider future office needs which will impact the office market for years.
Thus, our outlook remains cautious: vacancies will continue to rise and rents will decline further. However, rent declines will likely not accelerate until 2021 as layoffs from airlines and other industries that had been supported by the CARES Act will hit the economy; and more leases up for renewal are either not renewed, get downsized and/or are renewed at lower rents.
 Click on graph for larger image.
This graph shows the regional and strip mall vacancy rate starting in 1980 (prior to 2000 the data is annual).
For Neighborhood and Community malls (strip malls), the vacancy rate was 10.4% in Q3, up from 10.2% in Q2, and up from 10.1% in Q3 2019.
For strip malls, the vacancy rate peaked at 11.1% in Q3 2011, and the low was 9.8% in Q2 2016.
For Regional malls, the vacancy rate was 10.1% in Q3, up from 9.8% in Q2, and up from 9.4% in Q3 2019.
 This graph shows the office vacancy rate starting in 1980 (prior to 1999 the data is annual).
Reis reported the vacancy rate was at 17.4% in Q3, up from 17.1% in Q2, and up from 16.9% in Q3 2019. The office vacancy rate had been mostly moving sideways at an elevated level, but has increased over the last two years. And will likely increase further as leases expire.
 The third graph shows the apartment vacancy rate starting in 1980. (Annual rate before 1999, quarterly starting in 1999). Note: Reis is just for large cities.
Reis reported the vacancy rate was at 5.0% in Q3, up from 4.9% Q2, and up from 4.6% in Q3 2019.
The apartment vacancy rate will probably stay fairly low if there is additional disaster relief. However, the vacancy rate could increase sharply if the eviction moratoriums end and there is minimal additional disaster relief.
All vacancy data courtesy of Reis