by Calculated Risk on 8/24/2021 11:13:00 AM
Tuesday, August 24, 2021
A few Comments on July New Home Sales
New home sales for July were reported at 708,000 on a seasonally adjusted annual rate basis (SAAR). Sales for the previous three months were revised up, combined.
This was somewhat above consensus expectations for July, but still down 27.2% year-over-year - since sales increased sharply following the early months of the pandemic. The new home sales rate is now slightly below the pre-pandemic level of around 740 thousand (the three months previous to pandemic).
 Click on graph for larger image.
This graph shows new home sales for 2020 and 2021 by month (Seasonally Adjusted Annual Rate).
The year-over-year comparisons were easy in the first half of 2021 - especially in March and April.
However, sales will likely be down year-over-year for the remainder of 2021 - since the selling season was delayed in 2020.
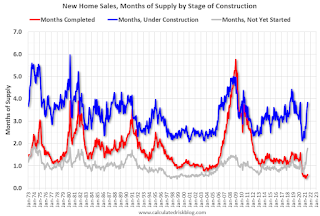
And on inventory: note that completed inventory (3rd graph in previous post) is near record lows, but inventory under construction is closer to normal.
 This graph shows the months of supply by stage of construction.
The inventory of completed homes for sale was at 36 thousand in July, just above the record low of 33 thousand in March, April and May 2021. That is about 0.6 months of completed supply (just above the record low).
The inventory of new homes under construction is at 3.8 months - slightly above the normal level.
However, a record 105 thousand homes have not been started - about 1.8 months of supply - about double the normal level.


