by Calculated Risk on 8/06/2021 02:08:00 PM
Friday, August 06, 2021
AAR: July Rail Carloads down, Intermodal Down Compared to 2019
From the Association of American Railroads (AAR) Rail Time Indicators. Graphs and excerpts reprinted with permission.
U.S. rail traffic in July 2021 was up over July 2020, but for most commodity categories the percentage increase was significantly lower than in other recent months, both because of more difficult comparisons and because various external factors have led to a recent deceleration in rail volumes. In July, total U.S. carloads were up 6.6% over July 2020 and down 13.3% from July 2019.
emphasis added
 Click on graph for larger image.
This graph from the Rail Time Indicators report shows the six week average of U.S. Carloads in 2019, 2020 and 2021:
U.S. railroads originated 904,670 total carloads in July 2021, up 6.6% over July 2020 and down 13.3% from July 2019. The 6.6% is the smallest year-over-year gain for total carloads in four months. Total carloads averaged 226,168 per week in July 2021, which is the smallest weekly average for any month since February 2021 and the smallest weekly average for July — other than July 2020 — since our records begin in 1988.
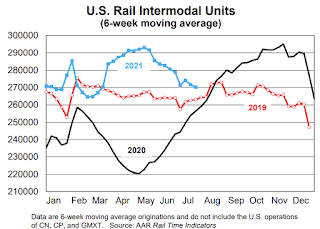
 The second graph shows the six week average (not monthly) of U.S. intermodal in 2019, 2020 and 2021: (using intermodal or shipping containers):
U.S. intermodal originations were up 1.5% in July 2021 over July 2020 but were down 1.9% from July 2019. ...
The carload categories that caused the biggest problems for U.S. rail volumes in July 2021 were motor vehicles and grain.


