by Calculated Risk on 8/03/2021 11:13:00 AM
Tuesday, August 03, 2021
NY Fed Q2 Report: Total Household Debt Increased in Q2 2021
From the NY Fed: Total Household Debt Climbs in Q2 2021, New Extensions of Credit Hit Series Highs
The Federal Reserve Bank of New York's Center for Microeconomic Data today issued its Quarterly Report on Household Debt and Credit . The report shows that total household debt increased by $313 billion (2.1%) to $14.96 trillion in the second quarter of 2021. The total debt balance is now $812 billion higher than at the end of 2019. The 2.1% increase in aggregate balances was the largest seen since Q4 2013 and marked the largest nominal increase in debt balances since Q2 2007. The Report is based on data from the New York Fed's Consumer Credit Panel, a nationally representative random sample of individual- and household-level debt and credit records drawn from anonymized Equifax credit data.
Mortgage balances—the largest component of household debt—rose by $282 billion and stood at $10.44 trillion at the end of June. Credit card balances started to tick back up, increasing by $17 billion in the second quarter. Despite the increase, credit card balances were still $140 billion lower than they had been at the end of 2019. Auto loans increased by $33 billion, while student loan balances decreased by $14 billion. In total, non-housing balances (including credit card, auto loan, student loan, and other debts) grew by $44 billion, with increases in auto loans and credit card balances offsetting the decline in student loan balances.
emphasis added
 Click on graph for larger image.
Here are two graphs from the report:
The first graph shows aggregate consumer debt increased in Q2. Household debt previously peaked in 2008, and bottomed in Q3 2013. Unlike following the great recession, there wasn't a huge decline in debt during the pandemic.
From the NY Fed:
Aggregate household debt balances increased by $313 billion in the second quarter of 2021, a 2.1% rise from 2021Q1, and now stand at $14.96 trillion. Balances are $812 billion higher than at the end of 2019 and $691 billion higher than 2020Q2. The 2.1% increase in aggregate balances was the largest seen since 2013Q4 and marked the largest nominal increase in debt balances since 2007Q2.
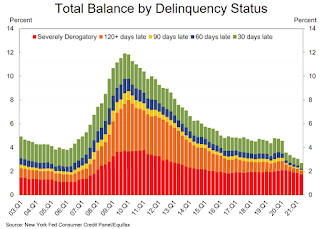
 The second graph shows the percent of debt in delinquency.
The overall delinquency rate decreased in Q2. From the NY Fed:
Aggregate delinquency rates have remained low and declining since the beginning of the pandemic recession, reflecting an uptake in forbearances (provided by both the CARES Act and voluntarily offered by lenders), which protect borrowers’ credit records from the reporting of skipped or deferred payments. As of late June, 2.7% of outstanding debt was in some stage of delinquency, a 2.0 percentage point decrease from the fourth quarter of 2019, just before the Covid pandemic hit the United States. Of the $405 billion of debt that is delinquent, $316 billion is seriously delinquent (at least 90 days late or “severely derogatory”, which includes some debts that have been removed from lenders’ books but upon which they continue to attempt collection).
 The third graph shows Mortgage Originations by Credit Score.
From the NY Fed:
Median mortgage origination credit scores were roughly flat, with the median credit score of newly originated mortgages at 786, reflecting a continuing high quality of underwriting standards and higher shares of refinances. ... There was $1.22 trillion in newly originated mortgage debt in 2021Q2, with 71% of it originated to borrowers with credit scores over 760.There is much more in the report.


