by Calculated Risk on 10/07/2021 11:38:00 AM
Thursday, October 07, 2021
September Employment Preview
On Friday at 8:30 AM ET, the BLS will release the employment report for September. The consensus is for 460 thousand jobs added, and for the unemployment rate to decrease to 5.1%.
 Click on graph for larger image.
• First, currently there are still about 5.3 million fewer jobs than in February 2020 (before the pandemic).
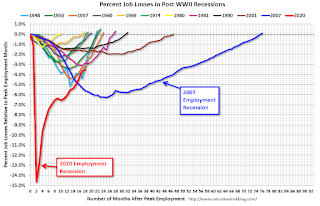
This graph shows the job losses from the start of the employment recession, in percentage terms.
The current employment recession was by far the worst recession since WWII in percentage terms, but is now better than the worst of the "Great Recession".
• ADP Report: The ADP employment report showed a gain of 568,000 private sector jobs, above the consensus estimate of 430,000 jobs added. The ADP report hasn't been very useful in predicting the BLS report, but this suggests the BLS report could be above expectations.
• ISM Surveys: Note that the ISM services are diffusion indexes based on the number of firms hiring (not the number of hires). The ISM® manufacturing employment index increased in September to 50.2%, up from 49.0% last month. This would suggest a decline in manufacturing employment of around 20,000 jobs in September. ADP showed 49,000 manufacturing jobs added.
The ISM® Services employment index decreased in September to 53.0%, down from 53.7% last month. This would suggest an increase in service employment of around 150,000 jobs in September.
Combined, the ISM indexes suggest a weaker than expected employment report.
• Unemployment Claims: The weekly claims report showed little change in the number of initial unemployment claims during the reference week (includes the 12th of the month) from 349,000 in August to 351,000 in September. This would usually suggest about the same number of layoffs in September as in August, although this might not be very useful right now. In general, weekly claims have been above expectations in September.
 • Permanent Job Losers: Something to watch in the employment report will be "Permanent job losers". While there has been a strong bounce back in total employment, from the shutdown in March and April 2020, permanent job losers hasn't increased as sharply.
This graph shows permanent job losers as a percent of the pre-recession peak in employment through the June report.
This data is only available back to 1994, so there is only data for three recessions. In August, the number of permanent job losers decreased to 2.487 million from 2.930 million in July. These jobs will likely be the hardest to recover.
• IMPORTANT: Usually in September, about 1.2 million educators are hired as the school year starts in some areas. This is seasonally adjusted to around 0 (since it is expected). It is unclear if that many will be hired this year - or more (making up for low hiring), or less (due to the ongoing pandemic). This could distort the headline number.
• Conclusion: The data is mixed for September. However, the consensus is fairly low.
As far as the pandemic, the number of daily cases during the reference week in September was around 142,000, up from around 128,000 in August. It did appear that cases peaked in early September, so by the reference week there was some optimism that cases were declining.
My sense is the report will be close to consensus expectations.


