Also, incoming port traffic is backed up significantly in the LA area with numerous ships at anchor waiting to unload.
Container traffic gives us an idea about the volume of goods being exported and imported - and usually some hints about the trade report since LA area ports handle about 40% of the nation's container port traffic.
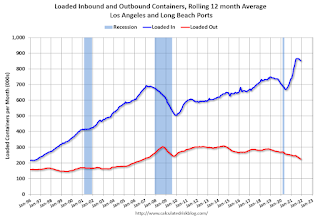
The following graphs are for inbound and outbound traffic at the ports of Los Angeles and Long Beach in TEUs (TEUs: 20-foot equivalent units or 20-foot-long cargo container).
To remove the strong seasonal component for inbound traffic, the first graph shows the rolling 12-month average.
 Click on graph for larger image.
On a rolling 12-month basis, inbound traffic was down 0.8% in November compared to the rolling 12 months ending in October. Outbound traffic was down 2.0% compared to the rolling 12 months ending the previous month.
The 2nd graph is the monthly data (with a strong seasonal pattern for imports).
 Usually imports peak in the July to October period as retailers import goods for the Christmas holiday, and then decline sharply and bottom in February or March depending on the timing of the Chinese New Year.
2021 started off incredibly strong for imports - and with the backlog of ships, will likely stay strong into 2022 (no break again in February or March).
It is disappointing that traffic dipped in November compared to the previous months so there are quite a few ships still waiting to unload.
Imports were down 10% YoY in November, and exports were down 22% YoY.