by Calculated Risk on 1/20/2022 08:54:00 PM
Thursday, January 20, 2022
COVID Update, January 20, 2022
| COVID Metrics | ||||
|---|---|---|---|---|
| Now | Week Ago | Goal | ||
| Percent fully Vaccinated | 63.2% | --- | ≥70.0%1 | |
| Fully Vaccinated (millions) | 209.8 | --- | ≥2321 | |
| New Cases per Day3 | 744,615 | 783,922 | ≤5,0002 | |
| Hospitalized3🚩 | 143,874 | 129,442 | ≤3,0002 | |
| Deaths per Day3 | 1,749 | 1,754 | ≤502 | |
| 1 Minimum to achieve "herd immunity" (estimated between 70% and 85%). 2my goals to stop daily posts, 37-day average for Cases, Currently Hospitalized, and Deaths 🚩 Increasing 7-day average week-over-week for Cases, Hospitalized, and Deaths ✅ Goal met. | ||||
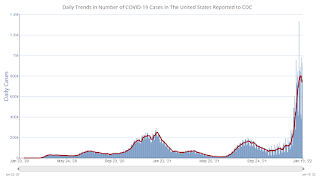
 Click on graph for larger image.
This graph shows the daily (columns) and 7-day average (line) of positive tests reported.
The 7-day average for new cases has declined slightly, but hospitalizations are at record levels.
Fortunately, deaths are still only half the previous 7-day average record of 3,421 per day in January 2021.


