by Calculated Risk on 3/09/2022 02:22:00 PM
Wednesday, March 09, 2022
Vehicle Sales Mix and Heavy Trucks
It will be interesting to see if high gasoline prices will lead to a higher percentage of passenger car sales.
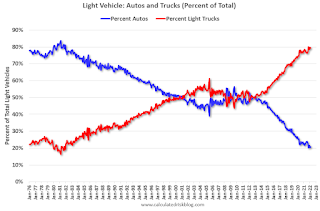
This graph shows the percent of light vehicle sales between passenger cars and trucks / SUVs through February 2022.
 Over time the mix has changed more and more towards light trucks and SUVs.
Only when oil prices are high, does the trend slow or reverse.
The percent of light trucks and SUVs was at 79.2% in February 2022 - just below the record high percentage of 80.0% last October.
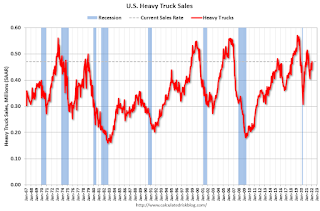
The second graph shows heavy truck sales since 1967 using data from the BEA. The dashed line is the February 2022 seasonally adjusted annual sales rate (SAAR).
Heavy truck sales really collapsed during the great recession, falling to a low of 180 thousand SAAR in May 2009. Then heavy truck sales increased to a new all time high of 563 thousand SAAR in September 2019.
Note: "Heavy trucks - trucks more than 14,000 pounds gross vehicle weight."
 Heavy truck sales really declined at the beginning of the pandemic, falling to a low of 299 thousand SAAR in May 2020.
 Heavy truck sales were at 471 thousand SAAR in February, up from 441 thousand SAAR in January, and up 2% from 460 thousand SAAR in February 2021.


