by Calculated Risk on 4/04/2022 06:04:00 PM
Monday, April 04, 2022
Lawler: What is the Yield Curve Signaling?
From housing economist Tom Lawler: What is the Yield Curve Signaling?
Before addressing the above question, here is a little quiz:
The current Treasury yield is by historical standards:
(a) Unusually steep
(b) A bit flatter than normal
(c) Very unusually inverted
(d) All of the above
The current answer is, of course, (d), as the current Treasury yield curve is historically very steep from 3-months to 2-years, a bit flatter than normal from 2- to 3-years, and inverted from 3- to 10-years. (And spreads between the 3-year Treasury and the Fed funds rate is at its widest level since 1994).
Below is a chart comparing average yields curves during the previous three decades compared to today’s (mid-afternoon) yield curve.
 Such “humped” yield curves as the current curve are unusual, and the degree of “humpiest” in the current curve is virtually unprecedented.
Many analysts, economists, and financial news reporters have expressed significant “angst” recently because the spread between the 10-year Treasury yield and the 2-year Treasury yields has turned slightly negative, and such “inversions” have been leading indicators of recessions (though lag times vary considerably.)
However, there is nothing “magical” about the “10/2” spread: other yield curve measures have been comparable or some have argued even better indicators of recessions/growth slowdowns. For example, in a March “reprise” of their 2018 paper, Fed economists Engstrom and Sharpe (https://www.federalreserve.gov/econres/notes/feds-notes/dont-fear-the-yield-curve-reprise-20220325.htm) argue that a much shorter term yield curve measure (the implied forward 3-month Treasury rate 6 months out compared to the current 3-month Treasury rate) is a better forward indicator than the 10/2 spread.
While I’m not a fan of their particular “curve” indicator because (1) it requires quotes on 21 month and 18 month Treasuries, which are not readily available on screens or historically, and (2) the short part of the Treasury curve has at times been much steeper than private money market yield curves for reasons other than “expectations” (see Rowe, Lawler, and Cook https://citeseerx.ist.psu.edu/viewdoc/download?doi=10.1.1.1009.2682&rep=rep1&type=pdf , 1986), there are other yield curve measures that have had the same or better “indicator” value as the 10/2 spread but which today are sending much different signals than the 10/2 spread.
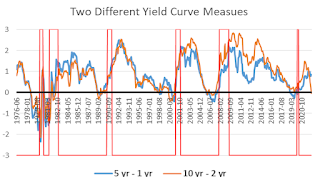
 E.g., [here] is a chart comparing the historical behavior of the spread between the 10-year and the 2-year Treasury with the spread between the 5-year and the 1-year Treasury. (Recessions are shown poorly in the chart.)
 As the chart shows, both of these yield curves meaasures have normally moved together, and both have typically inverted at about the same time – until recently. While the 10/2 spread went from an average of 79 bp in December of last year to negative 4 bp today, the 5/1 spread today is about 85 bp, down only slightly from the 93 bp average last December. And the spread between the 5-year Treasury and the Fed funds rate (not show here) has WIDENED to about 223 bp today from an 87 bp average last December.
 [Here] is another yield curve chart comparing spreads between 3-year Treasuries and Fed Funds as well as 3-year Treasuries and 6-month Treasuries from 1990 through today. This chart highlights have these yield curve measures have widened substantially this year. (The chart only goes back to 1990).
While the current “inversion” of the Treasury yield curve from 3-year to 10 years may reflect “the market’s” view that there may be a slowdown in the economy 3+year out in part because of substanial increases in the Fed’s target Fed funds rate over the next several years (though so far the Fed has only increased the funds rate by 25 bp current steepness of the the curve from the very short end to 3 years suggest that the yield curve is not giving any signals of a slowdown in economic growth over the next several years.


