by Calculated Risk on 5/06/2022 08:41:00 AM
Friday, May 06, 2022
April Employment Report: 428 thousand Jobs, 3.6% Unemployment Rate
From the BLS:
Total nonfarm payroll employment increased by 428,000 in April, and the unemployment rate was unchanged at 3.6 percent, the U.S. Bureau of Labor Statistics reported today. Job growth was widespread, led by gains in leisure and hospitality, in manufacturing, and in transportation and warehousing.
The change in total nonfarm payroll employment for February was revised down by 36,000, from +750,000 to +714,000, and the change for March was revised down by 3,000, from +431,000 to +428,000. With these revisions, employment in February and March combined is 39,000 lower than previously reported.
emphasis added
 Click on graph for larger image.
The first graph shows the job losses from the start of the employment recession, in percentage terms.
The current employment recession was by far the worst recession since WWII in percentage terms.
However, 26 months after the onset of the current employment recession, almost all of the jobs have returned.
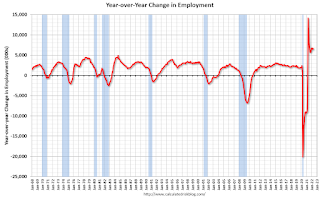
 The second graph shows the year-over-year change in total non-farm employment since 1968.
In April, the year-over-year change was 6.6 million jobs. This was up significantly year-over-year.
Total payrolls increased by 428 thousand in April. Private payrolls increased by 406 thousand, and public payrolls increased 22 thousand.
Payrolls for February and March were revised down 39 thousand, combined.
The third graph shows the employment population ratio and the participation rate.
 The Labor Force Participation Rate decreased to 62.2% in April, from 62.4% in March. This is the percentage of the working age population in the labor force.
The Employment-Population ratio decreased to 60.1% from 60.0% (blue line).
I'll post the 25 to 54 age group employment-population ratio graph later.
 The fourth graph shows the unemployment rate.
The unemployment rate was unchanged in April at 3.6% from 3.6% in March.
This was slightly above consensus expectations; however, February and March payrolls were revised down by 39,000 combined.
 The second graph shows the year-over-year change in total non-farm employment since 1968.
In April, the year-over-year change was 6.6 million jobs. This was up significantly year-over-year.
Total payrolls increased by 428 thousand in April. Private payrolls increased by 406 thousand, and public payrolls increased 22 thousand.
Payrolls for February and March were revised down 39 thousand, combined.
The third graph shows the employment population ratio and the participation rate.
 The Labor Force Participation Rate decreased to 62.2% in April, from 62.4% in March. This is the percentage of the working age population in the labor force.
 The Employment-Population ratio decreased to 60.1% from 60.0% (blue line).
I'll post the 25 to 54 age group employment-population ratio graph later.
 The fourth graph shows the unemployment rate.
 The unemployment rate was unchanged in April at 3.6% from 3.6% in March.
This was slightly above consensus expectations; however, February and March payrolls were revised down by 39,000 combined.
I'll have more later ...


