• Active inventory continued to grow, rising 11% above one year ago. In a few short weeks, we’ve observed a significant turnaround in the number of homes available for sale, going from essentially flat at the beginning of May weeks ago to +11% in this data from the last week of the month. This is helping to rebalance the housing market, but the trend must be understood in context. Our May Housing Trends Report showed that the active listings count remained nearly 50 percent below its level at the beginning of the pandemic. In other words, home shoppers continue to see a historically low number of homes for sale.
 Here is a graph of the year-over-year change in inventory according to realtor.com. Note: I corrected a sign error in the data for Feb 26, 2022.
Note the rapid increase in the YoY change, from down 30% at the beginning of the year, to up 11% YoY now. It will be important to watch if that trend continues.
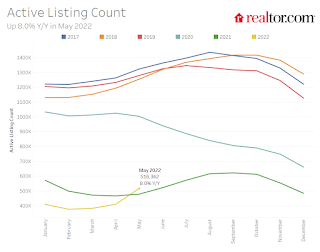
The second graph is from the May Housing Trends Report referenced above.

This shows realtor.com's estimate of active inventory over the last six years.
Note that inventory was declining rapidly for most of 2020, and it is very likely that inventory will be up compared to 2020 later this year.