by Calculated Risk on 8/28/2022 08:31:00 AM
Sunday, August 28, 2022
Hotels: Occupancy Rate Down 2.8% Compared to Same Week in 2019
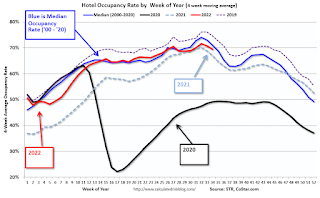
Occupancy for the week ending Aug. 20 was 67.3%, 1.2 percentage points lower than the previous week. Nominal average daily rate fell 1.1% week over week to $151, which is 17% higher than in 2019 and 10% greater than a year ago. Nominal revenue per available room contracted 2.8% week over week to $102, but remained ahead of 2019 by 12% and was up 17% from a year ago. Inflation-adjusted, or real, ADR was ahead of 2019 levels by 1%, whereas real RevPAR was below that benchmark by 3%.The following graph shows the seasonal pattern for the hotel occupancy rate using the four-week average.
...
While hotel demand — the number of room nights sold — has decreased week over week, it is only 1% lower than 2019 levels. Occupancy is 2.8 percentage points lower than in the comparable week of 2019 and 3.7 percentage points higher than a year ago. The difference between the demand and occupancy comparisons to 2019 is supply, which has increased by 2.6%. emphasis added
 Click on graph for larger image.
The red line is for 2022, black is 2020, blue is the median, and dashed light blue is for 2021. Dashed purple is 2019 (STR is comparing to a strong year for hotels).
The 4-week average of the occupancy rate is just below the median rate for the previous 20 years (Blue).
Note: Y-axis doesn't start at zero to better show the seasonal change.
The 4-week average of the occupancy rate has peaked seasonally and will now decline into the Fall.


